Optimal Timing for Superintelligence: Mundane Considerations for Existing People
[Sorry about the lengthiness of this post. I recommend not fixating too much on all the specific numbers and the formal apparatus. Originally the plan was to also analyze optimal timing from an impersonal (xrisk-minimization) perspective; but to prevent the text from ballooning even more, that topic was set aside for future work (which might never get done). But I should at least emphasize that there are other important factors, not covered here, that would need to be taken into account if one wishes to determine which timeline would be best all things considered.]
[Working paper.[1] Version 1.0. Canonical link to future revised version of this paper.]
Abstract
Developing superintelligence is not like playing Russian roulette; it is more like undergoing risky surgery for a condition that will otherwise prove fatal. We examine optimal timing from a person-affecting stance (and set aside simulation hypotheses and other arcane considerations). Models incorporating safety progress, temporal discounting, quality-of-life differentials, and concave QALY utilities suggest that even high catastrophe probabilities are often worth accepting. Prioritarian weighting further shortens timelines. For many parameter settings, the optimal strategy would involve moving quickly to AGI capability, then pausing briefly before full deployment: swift to harbor, slow to berth. But poorly implemented pauses could do more harm than good.
Introduction
Some have called for a pause or permanent halt to AI development, on grounds that it would otherwise lead to AGI and superintelligence, which would pose intolerable dangers, including existential risks. For instance, Eliezer Yudkowsky and Nate Soares argue in their recent book If Anyone Builds It, Everyone Dies that nations should enforce a global ban on advanced AI and the computational infrastructure to support it, and on research into improved AI algorithms.[2] These authors are extremely pessimistic about the prospects of aligned superintelligent AI, regarding its advent as an almost certain doom. In their view, creating superintelligence would be far worse than subjecting all of humanity to a universal death sentence.[3] Others have argued that even a much lower level of risk would warrant an indefinite moratorium on AI. Would it not be wildly irresponsible, they ask, to expose our entire species to even a 1-in-10 chance of annihilation?
However, sound policy analysis must weigh potential benefits alongside the risks of any emerging technology. Yudkowsky and Soares maintain that if anyone builds AGI, everyone dies. One could equally maintain that if nobody builds it, everyone dies. In fact, most people are already dead. The rest of us are on course to follow within a few short decades. For many individuals—such as the elderly and the gravely ill—the end is much closer. Part of the promise of superintelligence is that it might fundamentally change this condition.
For AGI and superintelligence (we refrain from imposing precise definitions of these terms, as the considerations in this paper don’t depend on exactly how the distinction is drawn), the potential benefits are immense. In particular, sufficiently advanced AI could remove or reduce many other risks to our survival, both as individuals and as a civilization.
Superintelligence would be able to enormously accelerate advances in biology and medicine—devising cures for all diseases and developing powerful anti-aging and rejuvenation therapies to restore the weak and sick to full youthful vigor.[4] (There are more radical possibilities beyond this, such as mind uploading, though our argument doesn’t require entertaining those.[5]) Imagine curing Alzheimer’s disease by regrowing the lost neurons in the patient’s brain. Imagine treating cancer with targeted therapies that eliminate every tumor cell but cause none of the horrible side effects of today’s chemotherapy. Imagine restoring ailing joints and clogged arteries to a pristine youthful condition. These scenarios become realistic and imminent with superintelligence guiding our science.
Aligned superintelligence could also do much to enhance humanity’s collective safety against global threats. It could advise us on the likely consequences of world-scale decisions, help coordinate efforts to avoid war, counter new bioweapons or other emerging dangers, and generally steer or stabilize various dynamics that might otherwise derail our future.
In short, if the transition to the era of superintelligence goes well, there is tremendous upside both for saving the lives of currently existing individuals and for safeguarding the long-term survival and flourishing of Earth-originating intelligent life. The choice before us, therefore, is not between a risk-free baseline and a risky AI venture. It is between different risky trajectories, each exposing us to a different set of hazards. Along one path (forgoing superintelligence), 170,000 people die every day of disease, aging, and other tragedies; there is widespread suffering among humans and animals; and we are exposed to some level of ongoing existential risk that looks set to increase (with the emergence of powerful technologies other than AI). The other path (developing superintelligence) introduces unprecedented risks from AI itself, including the possibility of catastrophic misalignment and other failure modes; but it also offers a chance to eliminate or greatly mitigate the baseline threats and misfortunes, and unlock wonderful new levels of flourishing. To decide wisely between these paths, we must compare their complex risk profiles—along with potential upsides—for each of us alive today, and for humanity as a whole.
With this in mind, it becomes clear (pace Hunt, Yampolskiy, and various other writers) that analogies likening AGI development to a game of Russian roulette are misplaced.[6] Yes, launching superintelligence entails substantial risk—but a better analogy is a patient with severe heart disease deciding whether to undergo risky surgery. Imagine a patient with advanced coronary artery disease who must weigh the immediate risk of bypass surgery against the ongoing risk of leaving the condition untreated. Without an operation, they might expect to live for several more months, with a gradually increasing daily risk of a fatal cardiac event. The risk of dying on any given day remains small, but it relentlessly accumulates over time. If they opt for surgery, they face a much higher risk of dying immediately on the operating table. However, if the procedure succeeds, the reward is many additional years of life in better health.
Whether the patient should undergo the operation, and if so when, depends on many variables—their tolerance for risk, their discount rate on future life years, whether a more skillful surgeon is likely to become available at some point, how much better their quality of life would be if the condition is cured, and so on. All these considerations have clear parallels in deciding whether and when to deploy transformative superintelligent AI.[7]
When we take both sides of the ledger into account, it becomes plausible that our individual life expectancy is higher if superintelligence is developed reasonably soon. Moreover, the life we stand to gain would plausibly be of immensely higher quality than the life we risk forfeiting. This conclusion holds even on highly pessimistic “doomer” assumptions about the probability of misaligned AI causing disaster.
Evaluative framework
To analyze all the facets of our predicament is possibly infeasible—certainly too complex to attempt in a single paper. However, we can examine some of the tradeoffs through a few different lenses, each providing a view on some of the relevant considerations. By breaking the issue down in this way, we can clarify some aspects of the macrostrategic choices we face, even if a comprehensive evaluation remains out of reach.
One distinction that may usefully be made is between what we could term mundane and arcane realms of consideration. By the former we refer to the ordinary kinds of secular considerations that most educated modern people would understand and not regard as outlandish or weird (given the postulated technological advances). The latter refers to all the rest—anthropics, simulation theory, aliens, trade between superintelligences, theology, noncausal decision theories, digital minds with moral status, infinite ethics, and whatnot. The arcane is, in the author’s view, relevant and important; but it is harder to get to grips with, and rolling it in upfront would obscure some simpler points that are worth making. In this paper, we therefore limit our purview to mundane considerations (leaving more exotic issues to possibly be addressed in subsequent work).[8]
Within either the mundane or arcane domain, we must also decide which evaluative standard to apply. In particular, we may distinguish between a person-affecting perspective, which focuses on the interests of existing people, and an impersonal perspective, which extends consideration to all possible future generations that may or may not come into existence depending on our choices. Individual mortality risks are salient in the person-affecting perspective, whereas existential risks emerge as a central concern in the impersonal perspective. In what follows, we adopt the person-affecting perspective (leaving an analysis from the impersonal perspective for future work).
We begin by introducing a very simple model. Subsequent sections will explore various complications and elaborations.[9]
A simple go/no-go model
Suppose that without superintelligence, the average remaining life expectancy is 40 years.[10] With superintelligence, we assume that rejuvenation medicine could reduce mortality rates to a constant level similar to that currently enjoyed by healthy 20-year-olds in developed countries, which corresponds to a life expectancy of around 1,400 years.[11] This is conservative, since superintelligence could also mitigate many non-aging causes of death—such as infectious diseases, accidents, and suicidal depression. It is also conservative because it ignores more radical possibilities (like mind uploading with periodic backup copies), which could yield vastly longer lifespans.[12]
Now consider a choice between never launching superintelligence or launching it immediately, where the latter carries an % risk of immediate universal death. Developing superintelligence increases our life expectancy if and only if:
In other words, under these conservative assumptions, developing superintelligence increases our remaining life expectancy provided that the probability of AI-induced annihilation is below 97%.
More generally, let m0 be the annual mortality hazard before AGI, and let m1 be the hazard after a successful AGI launch. Assign positive quality-of-life weights q0 and q1 to life before and after AGI, respectively. Launching immediately increases (quality-adjusted) life expectancy for those alive today iff:
Table 1 illustrates the risk cut-off values for different quality-of-life scenarios.
TABLE 1: Acceptable AI-risk if post-AGI life expectancy is 1,400 years
| Pre-AGI LE (y) | Post-AGI LE (y) | Max | |
|---|---|---|---|
| 40 | 1,400 | 1 | 97.1% |
| 40 | 1,400 | 2 | 98.6% |
| 40 | 1,400 | 10 | 99.7% |
Table 2 shows the corresponding thresholds if the gain in life expectancy were only 20 years (so post-AGI life expectancy is 60 years instead of 40)—perhaps a case in which the underlying aging processes for some reason remain unaddressed.
TABLE 2: Acceptable AI-risk if post-AGI life expectancy is 60 years
| Pre-AGI LE (y) | Post-AGI LE (y) | Max | |
|---|---|---|---|
| 40 | 60 | 1 | 33.3% |
| 40 | 60 | 2 | 66.7% |
| 40 | 60 | 10 | 93.3% |
We observe that, from a mundane person-affecting perspective—even without a difference in quality of life and with very modest assumptions about superintelligence-enabled life extension—developing superintelligence now would increase expected remaining lifespan even with fairly high levels of AI risk.[13]
Incorporating time and safety progress
The previous section treated the choice as binary: either launch superintelligence now or never launch it at all. In reality, however, we may instead face a timing decision. We may be able to make AGI safer by slowing its development or delaying its deployment, allowing further alignment research (and other precautions) to reduce the risk of catastrophic failure. This introduces a new tradeoff. Launching earlier means accepting a higher level of AI risk; launching later means extending the period during which people continue to die from ordinary causes and remain vulnerable to other background dangers.
This mirrors the medical analogy introduced earlier. A patient might postpone a risky operation in the hope that a safer method becomes available, but waiting exposes them to the ongoing risk of the underlying disease (and postpones their enjoying a state of improved health).
To formalize this idea (details in Appendix A), we assume that before AGI, individuals face a constant mortality hazard m0; after a successful launch, this drops to a much lower value m1. We also assume that the probability of catastrophic failure if AI is launched at time t declines gradually as safety work advances. The central question becomes: How long is it worth waiting for additional safety progress?
Table 3 shows representative “optimal waiting times” under different assumptions about the initial level of AGI risk and the (relative) rate at which that risk is reduced through further safety work. We include some perhaps unrealistically extreme values for initial (at ) and rate of safety progress to get a sense of the full space of possibilities.
TABLE 3: Optimal delay for various initial risks and rates of safety progress
| Safety Progress | 1% | 5% | 20% | 50% | 80% | 95% | 99% |
| No progress (0%/yr) | Launch asap | Launch asap | Launch asap | Launch asap | Launch asap | Launch asap | Never |
| Glacial (0.1%/yr) | Launch asap | Launch asap | Launch asap | Launch asap | Launch asap | Wait 16.9y | Wait 58.1y |
| Very slow (1%/yr) | Launch asap | Launch asap | Launch asap | Launch asap | Wait 14.3y | Wait 14.3y | Wait 35.5y |
| Moderate (10%/yr) | Launch asap | Launch asap | Wait 8.1m | Wait 9.4y | Wait 13.8y | Wait 15.5y | Wait 15.9y |
| Brisk (50%/yr) | Launch asap | Wait 6.8m | Wait 2.6y | Wait 3.9y | Wait 4.6y | Wait 4.8y | Wait 4.9y |
| Very fast (90%/yr) | Launch asap | Wait 8.2m | Wait 1.3y | Wait 1.7y | Wait 1.9y | Wait 2.0y | Wait 2.0y |
| Ultra-fast (99%/yr) | Wait 1.7m | Wait 5.9m | Wait 9.5m | Wait 11.9m | Wait 1.1y | Wait 1.1y | Wait 1.1y |
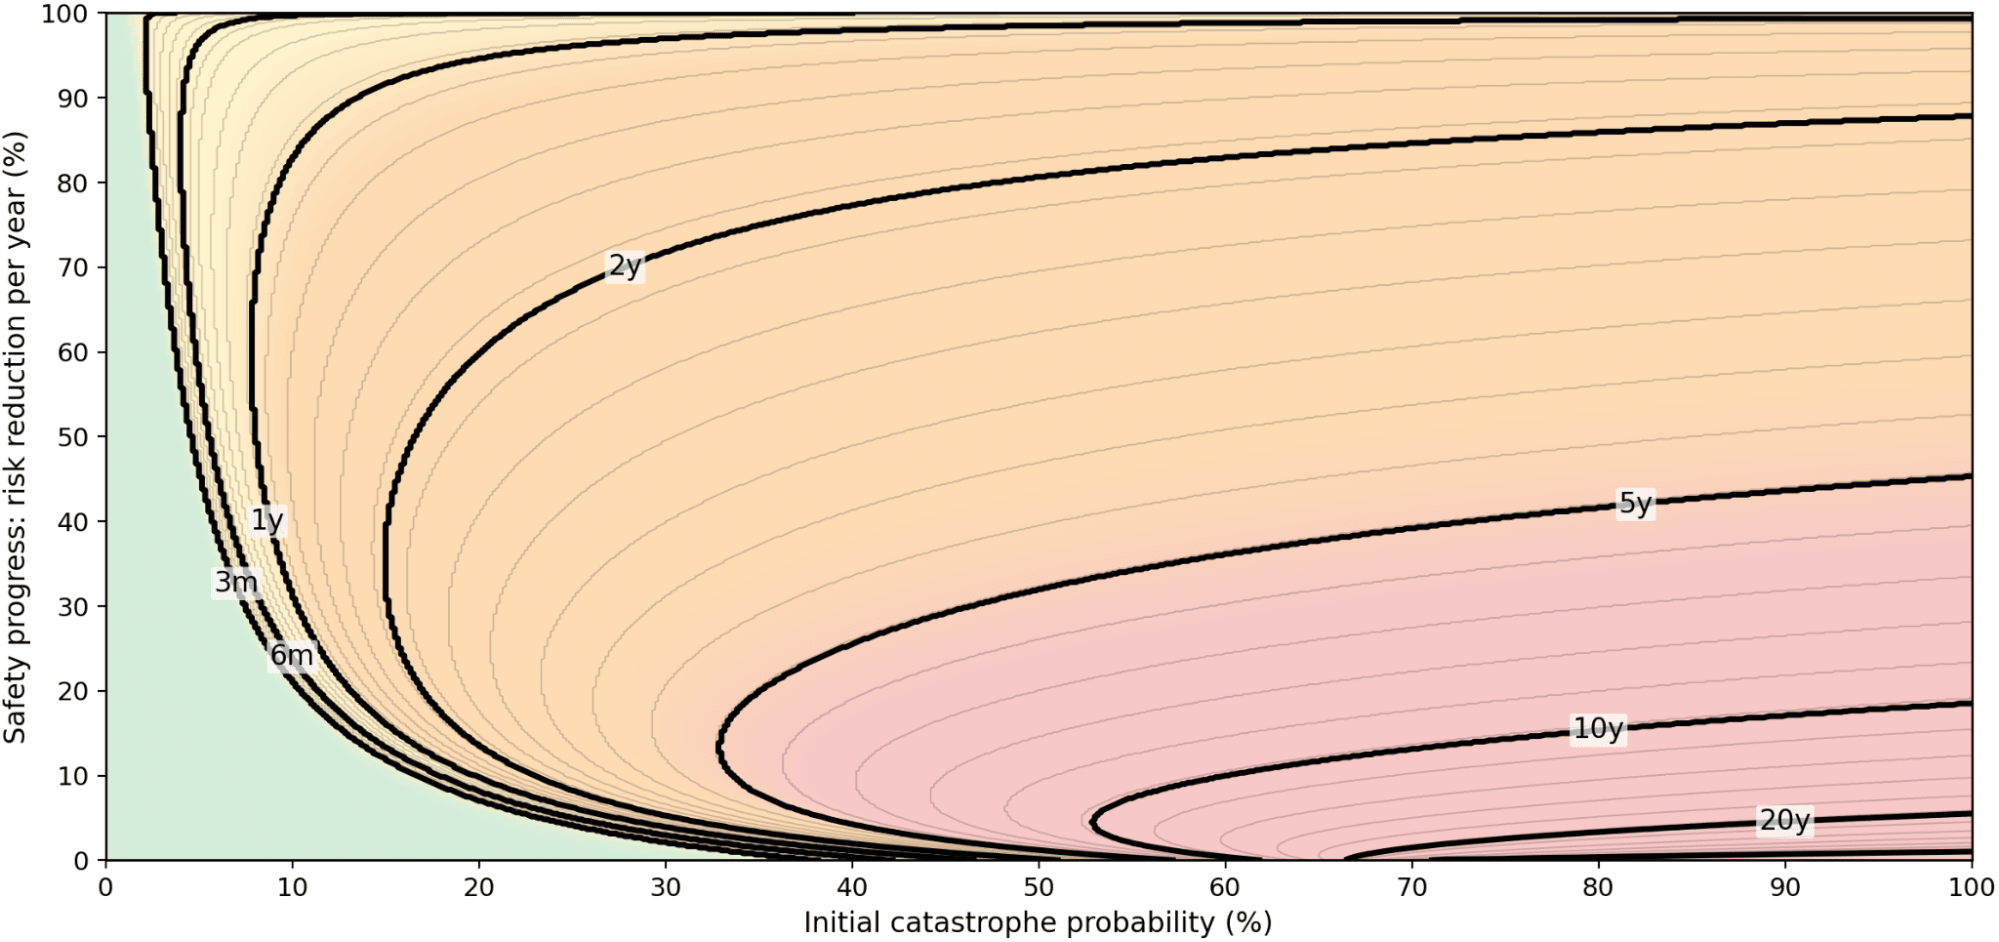
We observe a clear pattern. When the initial risk is low, the optimal strategy is to launch AGI as soon as possible—unless safety progress is exceptionally rapid, in which case a brief delay of a couple of months may be warranted. As the initial risk increases, optimal wait times become longer. But unless the starting risk is very high and safety progress is sluggish, the preferred delay remains modest—typically a single-digit number of years. The situation is further illustrated in Figure 1, which shows iso-delay contours across the parameter space.
Interestingly, both very fast and very slow rates of safety progress favor earlier launch. In the fast-progress case, the risk drops so quickly that there is no need to wait long. In the slow-progress case, waiting yields little benefit, so it is better to act sooner—while the potential gains are still reachable for many. It is intermediate-to-slow progress rates that produce the longest optimal delays: just slow enough that safety improvements accumulate only gradually, but fast enough that waiting still buys some benefit. (There is also a corner case: if the initial risk is extremely high and safety improvements are negligible or non-existent, the model recommends never launching at all.)
If we measured outcomes in quality-adjusted life years (QALYs) rather than raw life-years, we would in most cases become even more impatient to launch. However, in the current model, this effect is modest. The prospect of reducing mortality to that of a healthy 20-year-old already dominates the tradeoff, making the value of the short pre-AGI period relatively insignificant by comparison. What drives the result is the balance between the risk of dying before AGI arrives, and the risk of dying because the launch goes wrong.
FIGURE 1: Iso-delay contours (cf. Table 3)
Temporal discounting
Thus far, we have assumed that future life-years are valued equally regardless of when they occur. In practice, decision-makers often apply a temporal discount rate, which downweights benefits that occur further in the future. Various pragmatic factors that are sometimes baked into an economic discount rate can be set aside here. For example, we should not use the discount rate to account for the fact that we may prefer to frontload good things in our lives on the ground that we might not be around to enjoy them if they are postponed far into the future (since we are modeling mortality risks separately). But decision-makers are sometimes supposed to also have a “pure time preference”, where they simply care less about what happens further into the future, and this is what we will examine here.
Discounting weakens the incentive to “rush” for the vast long-term life extension that successful AGI might bring. The enormous benefit of gaining centuries of expected life is no longer valued at its full magnitude; whereas the risk of dying soon—either from a misaligned AGI or from current background hazards—remains at nearly full weight. As a result, introducing a discount rate shifts the optimal launch date later.
Table 4 illustrates the effect of a medium (3%) annual discount rate on optimal AGI timing. (Technical details appear in Appendix B, along with results for other discount rates.)
TABLE 4: Optimal delay with a 3% annual discount rate
| Safety Progress | 1% | 5% | 20% | 50% | 80% | 95% | 99% |
| No progress (0%/yr) | Launch asap | Launch asap | Launch asap | Never | Never | Never | Never |
| Glacial (0.1%/yr) | Launch asap | Launch asap | Launch asap | Wait 142.3y | Wait 612.0y | Wait 783.8y | Wait 825.0y |
| Very slow (1%/yr) | Launch asap | Launch asap | Launch asap | Wait 29.1y | Wait 75.8y | Wait 92.9y | Wait 97.0y |
| Moderate (10%/yr) | Launch asap | Launch asap | Wait 2.6y | Wait 11.3y | Wait 15.8y | Wait 17.4y | Wait 17.8y |
| Brisk (50%/yr) | Launch asap | Wait 7.5m | Wait 2.6y | Wait 3.9y | Wait 4.6y | Wait 4.9y | Wait 4.9y |
| Very fast (90%/yr) | Launch asap | Wait 8.2m | Wait 1.3y | Wait 1.7y | Wait 1.9y | Wait 2.0y | Wait 2.0y |
| Ultra-fast (99%/yr) | Wait 1.7m | Wait 5.9m | Wait 9.5m | Wait 11.9m | Wait 1.1y | Wait 1.1y | Wait 1.1y |
We see that some borderline cases shift from “launch immediately” to “wait a bit”; and cases that already warranted waiting now recommend longer delays. Higher discount rates would amplify this effect: if the far future counts for little, it makes sense to mostly focus on securing the near future.
Quality of life adjustment
One important hope is that developing superintelligence will not only extend life but also make it better. We can model this by assigning a quality weight to life before AGI and a higher weight to life after a successful AGI launch.
Table 5 shows optimal timing when post-AGI life is twice as good as current life () with a standard 3% discount rate. (See Appendix C for details and further illustrations.)
TABLE 5: Optimal delay: small quality difference (q₁/q₀ = 2, medium discount rate )
| Safety Progress | 1% | 5% | 20% | 50% | 80% | 95% | 99% |
| No progress (0%/yr) | Launch asap | Launch asap | Launch asap | Launch asap | Never | Never | Never |
| Glacial (0.1%/yr) | Launch asap | Launch asap | Launch asap | Launch asap | Wait 122.2y | Wait 294.0y | Wait 335.2y |
| Very slow (1%/yr) | Launch asap | Launch asap | Launch asap | Launch asap | Wait 27.1y | Wait 44.2y | Wait 48.3y |
| Moderate (10%/yr) | Launch asap | Launch asap | Launch asap | Wait 6.7y | Wait 11.1y | Wait 12.8y | Wait 13.2y |
| Brisk (50%/yr) | Launch asap | Launch asap | Wait 1.9y | Wait 3.2y | Wait 3.9y | Wait 4.2y | Wait 4.2y |
| Very fast (90%/yr) | Launch asap | Wait 5.7m | Wait 1.1y | Wait 1.5y | Wait 1.7y | Wait 1.8y | Wait 1.8y |
| Ultra-fast (99%/yr) | Wait 12.8d | Wait 4.6m | Wait 8.2m | Wait 10.6m | Wait 11.8m | Wait 1.0y | Wait 1.0y |
We can see that higher post-AGI quality expands the “launch asap” region, and shortens delays in the instances where waiting is optimal.
The magnitude of this shift is limited because the “launch-asap” risk bar—the level of AGI-risk below which it becomes optimal to launch immediately—is bounded above. This means that the quality-effect saturates: even arbitrarily large quality improvements cannot push all cases to immediate launch. Thus, if we postulated that post-AGI life would be 1,000 or 10,000 times better than pre-AGI life, this would not make much difference compared to more modest levels of quality improvement. Intuitively, once post-AGI life becomes sufficiently attractive (because of its length and/or quality), pre-AGI life contributes relatively little to the expected value of the future; and the chief concern then becomes maximizing the chance of actually reaching the post-AGI era—i.e. balancing the improvements in AGI safety that come from waiting against the accumulating risk of dying before AGI if the wait is too long.
Interestingly, the effect of temporal discounting can flip sign depending on the magnitude of the pre/post-AGI quality differential. When there is no quality differential, higher temporal discount rates always push towards launching later. However, when there is a quality differential that is sufficiently large, impatience penalizes delaying the onset of the higher-quality existence that would follow a successful superintelligence; and this pulls towards launching earlier. Consequently, while discounting always acts as a brake in the pure longevity model, it acts as an accelerator when the quality-of-life gap is sufficiently large.
Diminishing marginal utility
The preceding models have relied on a linear value assumption—essentially treating a 1,400-year lifespan as subjectively worth exactly 35 times as much as a 40-year lifespan. However, most people’s actual current preferences may exhibit diminishing marginal utility in quality-adjusted lifeyears (QALYs), meaning that e.g. a ten-year extension of a life that would otherwise be, say, 30 years is regarded as more desirable than a ten-year extension of a life that would otherwise be 1,390 years. Such a preference structure can also be viewed as a form of risk-aversion. Few people would accept a coin flip where “heads” means doubling their remaining lifespan and “tails” means dying immediately—and they may reject it even if we introduce a modest sweetener (such as a $10,000 reward or an additional bonus lifeyear if the coin lands heads).
We can model this using a standard diminishing-returns utility function—constant relative risk aversion (CRRA)—that introduces a curvature parameter, , representing the degree of risk-aversion. As this parameter increases, the decision-maker becomes more conservative, requiring higher probabilities of success (or greater potential upside) before betting their current life on a transformation.
Table 6 shows the results for , a typical value derived from the empirical health-economics literature. Other parameters are the same as in the previous section. (See Appendix D for details and additional illustrations.)
TABLE 6: Diminishing marginal utility (CRRA, medium rate)
| Safety Progress | 1% | 5% | 20% | 50% | 80% | 95% | 99% |
| No progress (0%/yr) | Launch asap | Launch asap | Launch asap | Launch asap | Never | Never | Never |
| Glacial (0.1%/yr) | Launch asap | Launch asap | Wait 3.1d | Wait 1.9y | Wait 122.6y | Wait 294.0y | Wait 335.2y |
| Very slow (1%/yr) | Launch asap | Launch asap | Wait 4.2d | Wait 4.4y | Wait 31.7y | Wait 46.3y | Wait 50.1y |
| Moderate (10%/yr) | Launch asap | Launch asap | Wait 1.1y | Wait 8.4y | Wait 12.5y | Wait 14.1y | Wait 14.4y |
| Brisk (50%/yr) | Launch asap | Wait 4.4m | Wait 2.3y | Wait 3.6y | Wait 4.2y | Wait 4.5y | Wait 4.5y |
| Very fast (90%/yr) | Launch asap | Wait 7.2m | Wait 1.2y | Wait 1.6y | Wait 1.8y | Wait 1.9y | Wait 1.9y |
| Ultra-fast (99%/yr) | Wait 1.2m | Wait 5.4m | Wait 9.0m | Wait 11.3m | Wait 1.0y | Wait 1.1y | Wait 1.1y |
Comparing this to Table 5, we see that diminishing marginal utility in QALYs leads to a somewhat more conservative approach: the zone of “launch asap” shrinks and optimal wait times increase. This effect is strongest for earlier dates. (See also Figure 2.)
FIGURE 2: Iso-delay contours (cf. Table 6)

Table 7 shows what the risk is if launch occurs at the optimal time (for the same parameter settings as Table 6).
TABLE 7: Risk-at-launch (for the same model)
| Safety Progress | 1% | 5% | 20% | 50% | 80% | 95% | 99% |
| No progress (0%/yr) | 1.0% | 5.0% | 20.0% | 50.0% | Never | Never | Never |
| Glacial (0.1%/yr) | 1.0% | 5.0% | 20.0% | 49.9% | 70.8% | 70.8% | 70.8% |
| Very slow (1%/yr) | 1.0% | 5.0% | 20.0% | 47.9% | 58.1% | 59.6% | 59.9% |
| Moderate (10%/yr) | 1.0% | 5.0% | 17.9% | 20.6% | 21.4% | 21.6% | 21.6% |
| Brisk (50%/yr) | 1.0% | 3.9% | 4.1% | 4.2% | 4.2% | 4.2% | 4.2% |
| Very fast (90%/yr) | 1.0% | 1.3% | 1.3% | 1.3% | 1.3% | 1.3% | 1.3% |
| Ultra-fast (99%/yr) | 0.6% | 0.6% | 0.6% | 0.6% | 0.6% | 0.6% | 0.6% |
These risk-at-launch values are somewhat—but not dramatically—reduced compared to those of a risk-neutral agent (except in cases where the risk-neutral agent would never launch or the risk-averse agent would launch asap, in which case risk-at-launch is the same for both).
Changing rates of safety progress
In the models considered so far, we assumed that AGI can be launched at any time, that background mortality remains constant until launch, that AI safety improves at a constant rate, and that no evidence about system safety is obtained beyond what that steady progress implies. In reality, however, we are not yet in a position to launch full AGI; background mortality risk could shift around the time AGI becomes available; the pace of safety progress is likely to vary across stages; and we may be able to run tests that provide direct information about whether a system is safe. We now explore how some of these factors affect the picture.
It is helpful to distinguish two timing variables:
: the time from now until full AGI first becomes technically deployable. We will refer to this period as Phase 1.
: any additional delay we choose after that point before deploying—a deliberate pause between AGI becoming available and being rolled out at scale. We will refer to such a period as Phase 2.
Launch thus occurs at time .
In principle, one could try to choose both variables so as to maximize expected (discounted, quality-adjusted) life-years. In practice, may be harder to affect to a degree that makes a significant difference. It is largely determined by the inherent technical difficulty of attaining AGI-level capabilities and by investment choices currently driven by intense competitive dynamics; whereas , in at least some scenarios, may be more a matter of deliberate choice by company leaders or policymakers who at that juncture may be more focused on making macrostrategically sound deployment decisions. Furthermore, as we shall see, relatively small changes to plausibly make a bigger difference to expected outcomes than similarly small changes to .
Before considering joint optimization over both variables, therefore, let us examine a model in which only is subject to choice. Here we treat as exogenous and given by the scenario (0, 5, 10, or 20 years until AGI availability). We retain the notation and parameters from previous sections, including exponential time discounting and concave utility (both at their “medium” values unless otherwise noted).
A key feature of this multiphase setup is that the rate of safety progress need not be constant. Different stages of development offer different opportunities for progress, and the most tractable problems tend to be solved first.
During Phase 1—the period before full AGI is available—safety researchers must work without access to the systems that will ultimately matter most. They can study precursor systems, develop theoretical frameworks, and devise alignment techniques that seem likely to scale; but the exact algorithms and architectures that enable full AGI remain unknown, limiting what can be tested or verified. Safety progress during this phase is therefore likely to be moderate.
The situation changes once AGI-ready systems are attained. In Phase 2, researchers can study the actual system, run it in constrained environments, probe its behavior under controlled conditions, and potentially leverage the system’s own capabilities to accelerate safety work. This suggests a burst of rapid safety progress immediately after AGI becomes available—a “safety windfall” from finally having the real artifact to work with.
Yet such rapid gains cannot continue indefinitely. The most promising interventions get explored first, and diminishing returns eventually set in. This motivates dividing Phase 2 into distinct subphases:
Phase 2a: An initial period of very rapid safety progress. With the full system now available, researchers can perform interventions that were previously impossible—shaping the system, probing failure modes while slowly ramping capabilities, and implementing oversight mechanisms on the actual weights. This subphase is brief (perhaps weeks to months) but highly productive.
Phase 2b: Continued fast progress, though slower than 2a. The most obvious low-hanging fruit has been picked, but researchers still benefit from working on the actual system, assisted by advanced AI tools. This might last around a year.
Phase 2c: Progress slows to a rate similar to Phase 1, the benefits of having the actual system now roughly offset by the depletion of tractable problems. This subphase might last several years.
Phase 2d: Ultimately progress becomes very slow, consisting of fundamental research into alignment science or the development of qualitatively new architectures. This continues indefinitely.
Figure 3 illustrates the qualitative picture. The key feature is that safety progress is front-loaded within Phase 2.
Figure 3. Qualitative picture of risk in a multiphase model
To make this concrete, Table 8 shows the optimal pause durations (from the start of Phase 2) for eight different scenarios. (For details, see Appendix E.)
TABLE 8: A multiphase model: several scenarios
| # | Phase 1 | 2a | 2b | 2c | 2d | 1% | 5% | 20% | 50% | 80% | 95% | 99% |
| ① | 0y | 0.3y 70%/y | 1.0y 25%/y | 5.0y 5%/y | ∞ 2%/y | Launch asap | Wait 3.6m | Wait 1.3y | Wait 1.3y | Wait 6.3y | Wait 6.3y | Wait 6.3y |
| ② | 0y | 0.3y 70%/y | 1.0y 25%/y | 5.0y 10%/y | ∞ 2%/y | Launch asap | Wait 3.6m | Wait 1.3y | Wait 4.1y | Wait 6.3y | Wait 6.3y | Wait 6.3y |
| ③ | 5y 5%/y | 0.3y 70%/y | 1.0y 25%/y | 5.0y 5%/y | ∞ 2%/y | Launch asap | Wait 3.6m | Wait 9.4m | Wait 1.3y | Wait 2.2y | Wait 5.0y | Wait 5.7y |
| ④ | 5y 10%/y | 0.3y 70%/y | 1.0y 25%/y | 5.0y 10%/y | ∞ 2%/y | Launch asap | Wait 1.5m | Wait 3.6m | Wait 1.3y | Wait 3.0y | Wait 4.5y | Wait 4.9y |
| ⑤ | 10y 5%/y | 0.3y 70%/y | 1.0y 25%/y | 5.0y 5%/y | ∞ 2%/y | Launch asap | Wait 1.2m | Wait 3.6m | Wait 1.3y | Wait 1.3y | Wait 1.3y | Wait 1.3y |
| ⑥ | 10y 10%/y | 0.3y 70%/y | 1.0y 25%/y | 5.0y 10%/y | ∞ 2%/y | Launch asap | Launch asap | Wait 3.6m | Wait 1.0y | Wait 1.3y | Wait 1.3y | Wait 1.3y |
| ⑦ | 20y 5%/y | 0.3y 70%/y | 1.0y 25%/y | 5.0y 5%/y | ∞ 2%/y | Launch asap | Launch asap | Wait 3.6m | Wait 11.1m | Wait 1.3y | Wait 1.3y | Wait 1.3y |
| ⑧ | 20y 10%/y | 0.3y 70%/y | 1.0y 25%/y | 5.0y 10%/y | ∞ 2%/y | Launch asap | Launch asap | Launch asap | Wait 3.6m | Wait 3.6m | Wait 3.6m | Wait 3.6m |
We see that for a wide range of initial risk levels and rates of safety progress, the optimal strategy is to implement a short pause once we enter Phase 2. If the “windfall” available in subphases 2a and 2b is significant, the optimal pause is often measured in months or a small number of years. Beyond that point, the safety benefits of further waiting tend to be outweighed by the continuing costs of mortality and temporal discounting.
If we instead consider jointly optimizing over both and —so that the decision-maker can choose how long Phase 1 lasts (up to the maximum given by each default scenario) and then also choose how long to pause after AGI-capability is attained—we get the results shown in Table 9. (For ease of comparison, the times are expressed relative to the point at which launch would have occurred “by default” in each scenario, i.e. if there were neither acceleration of Phase 1 nor any subsequent pause. For example, in scenario 4, where the default Phase 1 duration is 5 years, “Wait −3.7 y” means launch occurs 1.3 years after the beginning of Phase 1. Likewise, “launch asap” here denotes the time as it did previously, the point at which Phase 2 would have commenced by default.)
TABLE 9: Joint optimization over Phase 1 and Phase 2
| # | Phase 1 | 2a | 2b | 2c | 2d | 1% | 5% | 20% | 50% | 80% | 95% | 99% |
| ① | 0y | 0.3y 70%/y | 1y 25%/y | 5.0y 5%/y | ∞ 2%/y | Launch asap | Wait 3.6m | Wait 1.3y | Wait 1.3y | Wait 6.3y | Wait 6.3y | Wait 6.3y |
| ② | 0y | 0.3y 70%/y | 1y 25%/y | 5.0y 10%/y | ∞ 2%/y | Launch asap | Wait 3.6m | Wait 1.3y | Wait 4.1y | Wait 6.3y | Wait 6.3y | Wait 6.3y |
| ③ | 5y 5%/y | 0.3y 70%/y | 1y 25%/y | 5.0y 5%/y | ∞ 2%/y | Wait −5.0y | Wait −4.7y | Wait −3.7y | Wait −3.7y | Wait 2.2y | Wait 5.0y | Wait 5.7y |
| ④ | 5y 10%/y | 0.3y 70%/y | 1y 25%/y | 5.0y 10%/y | ∞ 2%/y | Wait −5.0y | Wait −4.7y | Wait −3.7y | Wait −11.3m | Wait 3.0y | Wait 4.5y | Wait 4.9y |
| ⑤ | 10y 5%/y | 0.3y 70%/y | 1y 25%/y | 5.0y 5%/y | ∞ 2%/y | Wait −10.0y | Wait −9.7y | Wait −8.7y | Wait −8.7y | Wait −2.8y | Launch asap | Wait 8.6m |
| ⑥ | 10y 10%/y | 0.3y 70%/y | 1y 25%/y | 5.0y 10%/y | ∞ 2%/y | Wait −10.0y | Wait −9.7y | Wait −8.7y | Wait −5.9y | Wait −2.0y | Wait −5.6m | Wait −1.3m |
| ⑦ | 20y 5%/y | 0.3y 70%/y | 1y 25%/y | 5.0y 5%/y | ∞ 2%/y | Wait −20.0y | Wait −19.7y | Wait −18.7y | Wait −18.7y | Wait −12.8y | Wait −10.0y | Wait −9.3y |
| ⑧ | 20y 10%/y | 0.3y 70%/y | 1y 25%/y | 5.0y 10%/y | ∞ 2%/y | Wait −20.0y | Wait −19.7y | Wait −18.7y | Wait −15.9y | Wait −12.0y | Wait −10.5y | Wait −10.1y |
We see that in many scenarios and for many initial levels of risk, if the decision-maker is free to jointly optimize over both AGI development time and subsequent pausing, it is optimal to launch earlier than would have happened by default: these are the cells with blue background. (In scenarios 1 and 2, acceleration is impossible since Phase 1 has zero duration.)
Additionally, there are several scenarios in which, although launch occurs in Phase 2 after some period of pausing, it is still optimal to accelerate to some extent in Phase 1: these are the cells that do not have blue background but do have blue borders. This can happen because the rate of risk reduction is faster in Phase 2a and 2b than during Phase 1. There is thus a special value in being able to pause for at least a short while after AGI-capability has been attained before deploying it; and it can be worth going faster through Phase 1 in order to harvest these rapid safety gains while still keeping the overall time until AGI deployment tolerably short.
Shifting mortality rates
We have been assuming a constant background mortality rate until the launch of AGI, yet it is conceivable that it could change around the time when AGI-capability is attained (but before it is fully deployed).
Pessimistically, the world might become more dangerous with the introduction of near-AGI capabilities. For example, specialized AI systems could proliferate the capability to produce (new and more lethal) bioweapons, enable vast swarms of autonomous drones, precipitate mayhem by destabilizing our individual or collective epistemic systems and political processes, or raise geopolitical stakes and urgency in such a way as to trigger major war.
Optimistically, one might hope that near-AGI systems would enable breakthroughs in medicine that reduce mortality rates. However, substantial mortality reductions seem unlikely to materialize quickly, since many medical innovations must pass through extensive clinical trials and then require further time to achieve globally significant scale. Near-AGI systems could, of course, also have many other positive effects; yet except possibly for medical applications, it seems unlikely that they would have a big immediate impact on average death rates, since most people who are currently dying are succumbing to age-related and other medical issues.
On balance, therefore, if there is a dramatic change in global mortality just around the time when AGI becomes possible, it seems likelier to be for the worse than for the better. This adds to the reasons for keeping wait times relatively short after AGI-capability (or near-AGI capability that starts having dangerous applications) has been attained.
Yet if a medical breakthrough were to emerge—and especially effective anti-aging therapies—then the optimal time to launch AGI could be pushed out considerably. In principle, such a breakthrough could come from either pre-AGI forms of AI (or specialized AGI applications that don’t require full deployment) or medical progress occurring independently of AI. Such developments are more plausible in long-timeline scenarios where AGI is not developed for several decades.
Note that for this effect to occur, it is not necessary for the improvement in background mortality to actually take place prior to or immediately upon entering Phase 2. In principle, the shift in optimal timelines could occur if an impending lowering of mortality becomes foreseeable; since this would immediately increase our expected lifespan under pre-launch conditions. For example, suppose we became confident that the rate of age-related decline will drop by 90% within 5 years (even without deploying AGI). It might then make sense to favor longer postponements—e.g. launching AGI in 50 years, when AI safety progress has brought the risk level down to a minimal level—since most of us could then still expect to be alive at that time. In this case, the 50 years of additional AI safety progress would be bought at the comparative bargain price of a death risk equivalent to waiting less than 10 years under current mortality conditions.
Table 10 shows the effects of postulating a precipitous drop in background mortality upon entering Phase 2—all the way to , i.e. the rate that corresponds to a life expectancy of 1,400 years, same as what we have been assuming successful AGI would achieve. (Other parameters are the same as in Table 8; and we are assuming here that Phase 1 cannot be accelerated.)
TABLE 10: Pre-deployment mortality plummeting to 1/1400 (medium temporal discounting)
| # | Phase 1 | 2a | 2b | 2c | 2d | 1% | 5% | 20% | 50% | 80% | 95% | 99% |
| ① | 0y | 0.3y 70%/y | 1.0y 25%/y | 5.0y 5%/y | ∞ 2%/y | Wait 1.1m | Wait 4.9m | Wait 1.3y | Wait 6.3y | Wait 18.0y | Wait 24.7y | Wait 26.4y |
| ② | 0y | 0.3y 70%/y | 1.0y 25%/y | 5.0y 10%/y | ∞ 2%/y | Wait 1.1m | Wait 4.9m | Wait 3.3y | Wait 6.3y | Wait 8.9y | Wait 14.5y | Wait 15.9y |
| ③ | 5y 5%/y | 0.3y 70%/y | 1.0y 25%/y | 5.0y 5%/y | ∞ 2%/y | Launch asap | Wait 3.6m | Wait 1.3y | Wait 6.3y | Wait 7.4y | Wait 13.6y | Wait 15.1y |
| ④ | 5y 10%/y | 0.3y 70%/y | 1.0y 25%/y | 5.0y 10%/y | ∞ 2%/y | Launch asap | Wait 3.6m | Wait 1.3y | Wait 6.1y | Wait 6.3y | Wait 6.3y | Wait 6.3y |
| ⑤ | 10y 5%/y | 0.3y 70%/y | 1.0y 25%/y | 5.0y 5%/y | ∞ 2%/y | Launch asap | Wait 3.6m | Wait 1.3y | Wait 1.5y | Wait 6.3y | Wait 6.3y | Wait 6.3y |
| ⑥ | 10y 10%/y | 0.3y 70%/y | 1.0y 25%/y | 5.0y 10%/y | ∞ 2%/y | Launch asap | Wait 3.6m | Wait 11.2m | Wait 1.3y | Wait 5.2y | Wait 6.3y | Wait 6.3y |
| ⑦ | 20y 5%/y | 0.3y 70%/y | 1.0y 25%/y | 5.0y 5%/y | ∞ 2%/y | Launch asap | Wait 3.6m | Wait 9.8m | Wait 1.3y | Wait 1.3y | Wait 2.5y | Wait 3.3y |
| ⑧ | 20y 10%/y | 0.3y 70%/y | 1.0y 25%/y | 5.0y 10%/y | ∞ 2%/y | Launch asap | Launch asap | Wait 3.6m | Wait 3.6m | Wait 1.3y | Wait 1.3y | Wait 1.3y |
We see that the optimal pause duration becomes longer—but not dramatically so. That the impact is fairly limited is due in part to safety gains being front-loaded, with diminishing returns arriving quickly after entering Phase 2. And in part it is due to the “medium”-level temporal discounting () dominating the mortality rate.
Table 11 shows the same scenarios but with the “low” discount rate (). This does lead to longer wait times, especially in scenarios where the initial AI risk is so high that even after the sizable reductions during Phase 1 and Phases 2a–c, the level of risk remains too high for comfort.
TABLE 11: Pre-deployment mortality plummeting to 1/1400 (low temporal discounting)
| # | Phase 1 | 2a | 2b | 2c | 2d | 1% | 5% | 20% | 50% | 80% | 95% | 99% |
| ① | 0y | 0.3y 70%/y | 1.0y 25%/y | 5.0y 5%/y | ∞ 2%/y | Wait 3.6m | Wait 1.3y | Wait 5.1y | Wait 14.9y | Wait 33.8y | Wait 41.2y | Wait 43.0y |
| ② | 0y | 0.3y 70%/y | 1.0y 25%/y | 5.0y 10%/y | ∞ 2%/y | Wait 3.6m | Wait 1.3y | Wait 6.3y | Wait 6.3y | Wait 22.5y | Wait 29.6y | Wait 31.3y |
| ③ | 5y 5%/y | 0.3y 70%/y | 1.0y 25%/y | 5.0y 5%/y | ∞ 2%/y | Wait 3.6m | Wait 1.3y | Wait 1.3y | Wait 6.3y | Wait 22.2y | Wait 29.4y | Wait 31.2y |
| ④ | 5y 10%/y | 0.3y 70%/y | 1.0y 25%/y | 5.0y 10%/y | ∞ 2%/y | Wait 1.6m | Wait 4.6m | Wait 3.2y | Wait 6.3y | Wait 6.3y | Wait 7.8y | Wait 9.3y |
| ⑤ | 10y 5%/y | 0.3y 70%/y | 1.0y 25%/y | 5.0y 5%/y | ∞ 2%/y | Wait 1.4m | Wait 3.7m | Wait 1.3y | Wait 6.3y | Wait 10.7y | Wait 17.7y | Wait 19.4y |
| ⑥ | 10y 10%/y | 0.3y 70%/y | 1.0y 25%/y | 5.0y 10%/y | ∞ 2%/y | Launch asap | Wait 3.6m | Wait 1.3y | Wait 6.3y | Wait 6.3y | Wait 6.3y | Wait 6.3y |
| ⑦ | 20y 5%/y | 0.3y 70%/y | 1.0y 25%/y | 5.0y 5%/y | ∞ 2%/y | Launch asap | Wait 3.6m | Wait 1.3y | Wait 1.3y | Wait 6.3y | Wait 6.3y | Wait 6.3y |
| ⑧ | 20y 10%/y | 0.3y 70%/y | 1.0y 25%/y | 5.0y 10%/y | ∞ 2%/y | Launch asap | Wait 1.1m | Wait 3.6m | Wait 1.3y | Wait 1.3y | Wait 2.2y | Wait 2.6y |
Thus, if the background mortality risk is greatly reduced, then those with a low discount rate would be willing to wait a long time in order for AI risk to decline to a very low level. Note, however, that even if people stopped dying altogether, it could still be optimal to launch AGI eventually—and in fact to do so without extremely long delays—provided only there is a significant quality-of-life differential, a nontrivial temporal discount rate, and that AI safety continues to improve appreciably.
For contrast, Table 12 illustrates the situation for the opposite scenario, where mortality rates rise upon entering Phase 2. Unsurprisingly, this shortens optimal pause durations. The effect for the parameter-setting used in this table—a doubling of the mortality rate—is fairly modest. It would be more pronounced for greater elevations in the level of peril.
TABLE 12: Pre-deployment mortality rising to 1⁄20 (medium temporal discounting)
| # | Phase 1 | 2a | 2b | 2c | 2d | 1% | 5% | 20% | 50% | 80% | 95% | 99% |
| ① | 0y | 0.3y 70%/y | 1.0y 25%/y | 5.0y 5%/y | ∞ 2%/y | Launch asap | Wait 2.9m | Wait 6.6m | Wait 1.3y | Wait 2.6y | Wait 5.0y | Wait 5.6y |
| ② | 0y | 0.3y 70%/y | 1.0y 25%/y | 5.0y 10%/y | ∞ 2%/y | Launch asap | Wait 2.9m | Wait 6.6m | Wait 1.3y | Wait 4.8y | Wait 6.3y | Wait 6.3y |
| ③ | 5y 5%/y | 0.3y 70%/y | 1.0y 25%/y | 5.0y 5%/y | ∞ 2%/y | Launch asap | Launch asap | Wait 3.6m | Wait 1.3y | Wait 1.3y | Wait 1.3y | Wait 1.3y |
| ④ | 5y 10%/y | 0.3y 70%/y | 1.0y 25%/y | 5.0y 10%/y | ∞ 2%/y | Launch asap | Launch asap | Wait 3.6m | Wait 1.3y | Wait 1.3y | Wait 1.3y | Wait 1.7y |
| ⑤ | 10y 5%/y | 0.3y 70%/y | 1.0y 25%/y | 5.0y 5%/y | ∞ 2%/y | Launch asap | Launch asap | Wait 3.6m | Wait 1.3y | Wait 1.3y | Wait 1.3y | Wait 1.3y |
| ⑥ | 10y 10%/y | 0.3y 70%/y | 1.0y 25%/y | 5.0y 10%/y | ∞ 2%/y | Launch asap | Launch asap | Wait 3.6m | Wait 3.6m | Wait 1.2y | Wait 1.3y | Wait 1.3y |
| ⑦ | 20y 5%/y | 0.3y 70%/y | 1.0y 25%/y | 5.0y 5%/y | ∞ 2%/y | Launch asap | Launch asap | Wait 3.6m | Wait 3.6m | Wait 1.1y | Wait 1.3y | Wait 1.3y |
| ⑧ | 20y 10%/y | 0.3y 70%/y | 1.0y 25%/y | 5.0y 10%/y | ∞ 2%/y | Launch asap | Launch asap | Launch asap | Wait 3.0m | Wait 3.6m | Wait 3.6m | Wait 3.6m |
Safety testing
AI safety work can provide at least two types of benefit: first, it can improve the nature of an AI system so that it is less likely to cause catastrophic harm if deployed; second, it can provide information about that nature, so that we can better judge whether to deploy it or to keep working to make it safer. The previous sections modeled both effects with a single parameter (the “rate of AI safety progress”). If we are willing to tolerate a more complicated setup, we can instead treat them separately. This leads to models where what is determined in advance is not an optimal launch time but an optimal policy that specifies—conditional on whatever safety information is then available—whether to launch or to continue working and testing.
To keep the setup manageable, we graft a simple testing process onto the multiphase model from the previous section. Once AGI‑capable systems exist (the start of Phase 2), the true catastrophe probability at that time is unknown: it could be any of seven values, corresponding to the initial risk levels used earlier (1 %, 5 %, 20 %, 50 %, 80 %, 95 %, or 99 %). We assume a uniform prior over these possibilities. Safety work reduces the underlying risk over time following the same multiphase schedule as before: Phase 1 with moderate progress, followed (once AGI‑capable systems exist) by a brief period of very rapid safety improvement (Phase 2a), a somewhat slower but still fast phase (2b), a medium‑progress phase (2c), and then a long tail of very slow progress (2d).
Safety tests are triggered by safety progress rather than by clock time. Starting from the moment AGI‑capable systems are available, a new test is performed every time safety work has reduced the system’s intrinsic catastrophe probability by another 20 % relative to the last test. This reflects the idea that developing informative tests is itself part of safety work: as we make the system safer, we also learn how to probe it more effectively. If the underlying risk at the moment of testing is , the test returns “fail” with probability and “pass” with probability . Systems with very high intrinsic riskiness therefore tend to fail tests repeatedly, whereas fairly safe systems mostly pass—even if their remaining risk is still substantial. In particular, these tests usually cannot distinguish reliably between, say, ten and twenty per cent risk at launch; they are better at separating “clearly terrible” from “not obviously terrible”.
We can formalize this setup as a partially observed Markov decision process (POMDP) and compute the optimal policy numerically (see Appendix G for details). Table 13 shows the expected delays (counting from the beginning of Phase 2).
TABLE 13: Periodic safety tests
| # | Phase 1 | 2a | 2b | 2c | 2d | 1% | 5% | 20% | 50% | 80% | 95% | 99% |
| ① | 0y | 0.3y 70%/y | 1y 25%/y | 5.0y 5%/y | ∞ 2%/y | Wait 1.4y | Wait 1.7y | Wait 2.7y | Wait 4.9y | Wait 7.3y | Wait 8.6y | Wait 8.9y |
| ② | 0y | 0.3y 70%/y | 1y 25%/y | 5.0y 10%/y | ∞ 2%/y | Wait 1.6y | Wait 2.0y | Wait 3.2y | Wait 4.8y | Wait 5.8y | Wait 6.1y | Wait 6.1y |
| ③ | 5y 5%/y | 0.3y 70%/y | 1y 25%/y | 5.0y 5%/y | ∞ 2%/y | Wait 1.1y | Wait 1.2y | Wait 1.7y | Wait 3.1y | Wait 4.7y | Wait 5.3y | Wait 5.5y |
| ④ | 5y 10%/y | 0.3y 70%/y | 1y 25%/y | 5.0y 10%/y | ∞ 2%/y | Wait 4.7m | Wait 6.6m | Wait 1.3y | Wait 3.1y | Wait 4.8y | Wait 5.4y | Wait 5.6y |
| ⑤ | 10y 5%/y | 0.3y 70%/y | 1y 25%/y | 5.0y 5%/y | ∞ 2%/y | Wait 5.1m | Wait 6.1m | Wait 10.5m | Wait 1.8y | Wait 3.1y | Wait 3.7y | Wait 3.9y |
| ⑥ | 10y 10%/y | 0.3y 70%/y | 1y 25%/y | 5.0y 10%/y | ∞ 2%/y | Wait 3.9m | Wait 5.3m | Wait 9.2m | Wait 1.2y | Wait 1.5y | Wait 1.7y | Wait 1.7y |
| ⑦ | 20y 5%/y | 0.3y 70%/y | 1y 25%/y | 5.0y 5%/y | ∞ 2%/y | Wait 3.9m | Wait 5.3m | Wait 9.2m | Wait 1.1y | Wait 1.3y | Wait 1.3y | Wait 1.3y |
| ⑧ | 20y 10%/y | 0.3y 70%/y | 1y 25%/y | 5.0y 10%/y | ∞ 2%/y | Launch asap | Launch asap | Wait 1.9m | Wait 3.4m | Wait 4.5m | Wait 5.2m | Wait 5.4m |
We observe that in most cases, the optimal policy results in an expected short (but greater-than-zero) delay, to take advantage of the rapid safety progress and concomitant opportunities gaining more information about the system’s riskiness available in Phases 2a and 2b. Conditional on the system’s initial riskiness being high when entering Phase 2, waiting times are longer; whereas when this is not the case, the optimal policy typically recommends launching within a year or two.
Note that Table 13 is not directly comparable to Table 8 (which represents the multiphase model analyzed earlier, the one most similar to the present model). This is because earlier we assumed that the decision-maker knew the initial riskiness of the system, whereas in the current model the agent starts out with a uniform probability distribution over the seven possible initial risk levels. If we want to pinpoint the difference that testing makes, we need to compare it to a baseline in which the agent starts out with the same agnostic distribution yet gains no further information from safety testing. Table 14 presents the result of such a comparison.
TABLE 14: Difference in outcomes from safety tests
| # | Avg launch (no tests) | Avg launch (tests) | Δ wait | Risk (no tests) | Risk (tests) | Δ risk | Utility gain |
| ① | 3.90y | 5.05y | +1.15y | 22.9% | 20.6% | -2.2% | +3.58% |
| ② | 6.30y | 4.23y | -2.07y | 15.4% | 16.9% | +1.5% | +2.95% |
| ③ | 1.30y | 3.23y | +1.93y | 20.2% | 17.3% | -2.9% | +1.31% |
| ④ | 1.50y | 3.03y | +1.53y | 15.1% | 11.5% | -3.6% | +1.71% |
| ⑤ | 1.30y | 2.05y | +0.75y | 15.7% | 14.8% | -0.9% | +0.37% |
| ⑥ | 1.30y | 1.09y | -0.21y | 9.1% | 9.1% | +0.0% | +0.45% |
| ⑦ | 1.30y | 0.93y | -0.37y | 9.4% | 9.6% | +0.3% | +0.28% |
| ⑧ | 0.30y | 0.25y | -0.05y | 4.2% | 4.2% | +0.0% | +0.06% |
We see that testing increases expected utility, sometimes by shortening the expected time-to-launch and sometimes by reducing the expected risk-at-launch. (That the expected utility gains look quite small in percentage terms is not particularly significant—this is driven by the infrequency and low sensitivity we assume of the tests and by other modeling assumptions. In reality, tests may also provide value by guiding future safety work in more productive directions.)
Figure 4 further illustrates how safety testing affects launch times. The dashed lines indicate where launches occur without safety testing (but with the agnostic prior over initial riskiness levels) for each of the eight scenarios. The solid lines show the cumulative probability distributions for the optimal policy with safety testing. We see that safety testing results in early launches in worlds where tests repeatedly pass, and later launches where tests keep failing and the posterior remains pessimistic.
FIGURE 4: Cumulative distribution functions of launch times with versus w/o safety tests
The main takeaway is that once system safety is uncertain, and future tests may provide information about how risky a system is, the relevant object is not a single optimal launch date but an optimal policy that conditions on evidence. Such a policy does something no fixed delay can do: it launches quickly when tests indicate the system is likely to be safe enough, but delays when tests reveal signs of danger. (The value of safety testing, however, depends not only on the quality of the tests themselves but—crucially—also on whether decision‑makers are willing and able to let deployment decisions actually respond to what the tests reveal.)
Distributional considerations
We have analyzed the situation from the standpoint of the current world population as a whole. However, we need to acknowledge that the prudentially optimal timing for superintelligence is not the same for everyone.
One important factor of divergence is that people’s mortality rates differ. Elderly people face a higher likelihood in the status quo of dying in the near future, while the young and hale could tolerate longer delays without accumulating an excessive risk of perishing before the main event.
Another factor is that those whose present quality of life is poor could rationally accept a higher risk of death for a shot at experiencing the great abundance and efflorescence that successful AGI would enable than those who are currently enjoying (what in present era is regarded as) a high standard of living.
There are therefore conflicts between different demographics over what is prudentially optimal regarding the timing of AGI. Other things equal, those who are old, sick, poor, downtrodden, miserable—or who have higher discount rates or less concave preferences over future quality-adjusted life years—should prefer earlier AGI launch dates compared to people who are comparatively satisfied and secure in the status quo.[14]
In the public policy literature, social welfare functions are often designed to include a prioritarian or egalitarian skew, such that a higher desirability is assigned (ceteris paribus) to outcomes in which the worst-off receive a given boost to their welfare than to ones in which a boost of equal magnitude is given to those who are already better-off.[15] If such priority is given to the worse off, and we combine this stipulation with the observations already made about the divergent prudential interests of different demographics, there may be implications for what is globally optimal regarding AI timelines.
In particular, the optimal timeline to superintelligence is likely shorter on a prioritarian view than it is on a neutral (person-affecting) utilitarian stance. This is partly because the worse off have less to lose and more to gain from rolling these dice. And partly it is because, in the case of the sick and the elderly, they have less ability to wait and roll the dice later when the odds may be more favourable. There is therefore a prioritarian argument for accelerating timelines beyond what the preceding analysis suggests.
Let us examine these issues a little more closely. One possible thought one might have is that the younger age structure in low-income countries would reduce the strength of the aforementioned prioritarian argument for shorter timelines, by introducing a correlation between being worse off and having longer remaining life expectancy—so that poor people in the developing world would have a prudential interest in longer AGI timelines compared to their better-off counterparts in rich countries. However, although the population does skew younger in poor countries, this is not enough to make up for the generally higher life expectancy in rich countries. The difference in life expectancy between rich and poor countries—which can exceed 25 years at birth when comparing the richest and poorest nations—narrows considerably when calculated as a population-weighted average of remaining years, due to the younger age structure in poorer countries. However, it does not close, let alone reverse.[16] While some convergence in life expectancy between poor and rich countries might be expected to occur during the remaining lifetime of people living in poor countries, it still seems plausible that, on average, people who are currently economically unfortunate can also expect to die sooner under default conditions than people who are currently economically fortunate. This positive correlation between poverty and lower remaining life expectancy strengthens the prioritarian case for faster timelines (compared to the distribution-agnostic analysis of the preceding sections).
One may also regard lifespan itself as a contributing factor in how fortunate a person is, and hence—on a prioritarian view—in how strong a claim they have to marginal resources or weighting of their marginal interests in the context of social planning. There are several different possible ways in which lifespan-related variation could be taken to influence somebody’s baseline welfare level:
i. Remaining life years. One might hold that (ceteris paribus) persons with more remaining life years are better off than those with fewer years left, since it seems unfortunate to be in a condition in which one is soon about to get sick and die.
If one adopts this stance, then the prioritarian skew towards shorter timelines would be amplified. This is because older people—whose interests favor shorter timelines—would be weighted more heavily by this metric, since it would adjudge them comparatively unfortunate in the status quo.
ii. Life years already had. One might hold that (ceteris paribus) persons who have lived longer are better off, on grounds that they have gotten to feast more on life.
If one adopts this stance, then the prioritarian skew would be pulled in the direction favoring longer timelines, since the metric implied by (ii) would tend to deem older people as better off and hence less deserving of marginal consideration. It would not necessarily pull it far enough to make the prioritarian favor longer timelines all things considered compared to a neutral (non-prioritarian) criterion, since there are other categories of badly-off people (aside from, supposedly, the young) and who may have interests that differentially benefit from shorter timelines.
However, in any case, (ii) seems like a mistaken way to reckon. Consider two persons, a 10-year-old and a 20-year-old, both of whom have a genetic condition from which they will die at age 30, unless they receive a therapy, of which only one dose is available—in which case they live to age 50. It seems implausible to maintain that the 10-year-old has a stronger claim to the therapy just because he hasn’t lived as long as the 20-year-old. It seems more plausible that their claims are equally strong—or, if not, then perhaps that the 20-year-old has a stronger claim (as would be implied by (i)).
A more plausible way to capture whatever intuition might appear to support (ii) would be:
iii. Total life years. One might hold that (ceteris paribus) persons whose total lifespans are longer are better off, since their endowment of life is greater.
This would accord the 10-year-old and the 20-year-old in the previous example equal weight, since they have the same baseline length of lifespan. When coupled with a prioritarian ethic, stance (iii) results in greater weight being placed on the interests of those whose lives in the default condition would be shorter.
So whose lives would, absent AGI, be shorter: the lives of the old or the lives of the young? On the one hand, the old have already survived all the hazards that kill some people prematurely. On the other hand, the young can expect to benefit from many decades of economic and medical progress which might prolong their lives. If we extrapolate recent rates of increases in life expectancy, in wealthy countries, we may get a U-shaped curve: younger people and the very oldest people have the longest total life expectancy, with the nadir occurring for those who are around age 80. (Intuitively: somebody who’s a centenarian has already lived longer than a newborn is likely to do, while a child has an advantage over people who are in their forties because the child is very likely to make it to forty and then gets benefit from four more decades of medical progress.) Since there are many more people who are substantially younger than 80 than who are substantially older than 80, this means there is a positive correlation between youth and total life expectancy. Hence (iii) induces an overall prioritarian downweighting of the interests of the young in wealthy countries. This would shorten the optimal timeline to AGI. In poor countries, however, the relationship may be more complicated due to high infant mortality: newborns have low expected total lifespans; young adults, high expected total lifespans, older adults, lower expected total lifespans; and the very old, high expected total lifespans. Absent a detailed quantitative analysis, it is not obvious how that adds up.
If one expects a radical breakthrough in life extension will happen, even in the absence of AGI, years from now, which will enable people to live very long lives, such as two hundred years (or even to attain longevity “escape velocity”), then a discontinuity is introduced whereby those who would live less than years without AGI are comparatively a lot more unfortunate according to (iii) than those who without AGI have more than years left to live. Those with less than years left to live without AGI would thus have their interests upweighted in a prioritarian social welfare function. This would increase the shift towards shorter timelines being optimal, assuming that is within the lifetime of at least some significant fraction of currently living people.
Note that these effects from prioritarian upweighting of those with shorter total life expectancy—or those with shorter remaining life expectancy, if we adopt stance (i)—are additional to the effect that results from whatever extra benefit there is to adding life years to otherwise short lives that stem directly from diminishing marginal utility in life years (or QALYs). In other words, there are two possible reasons for giving an extra life year to a short-lived person rather than to a long-lived person, which are analogous to two possible reasons for giving a hundred dollar bill to a poor person rather than to a rich person: first, the poor person may derive a greater benefit from the hundred dollars; and second, the poor person might be overall worse off than the rich person, and would therefore—on a prioritarian ethic—have a stronger claim to marginal benefits (such that even if we suppose that the rich person would derive an equally large benefit from the hundred dollar bill—perhaps they are out of cash and need a taxi home—it would still be better for it to go to the poor person).
Yet another possible stance on how life chronology could be a prioritarian weight-factor is that there is some specific number of life years—for instance, the traditional three-score-and-ten—such that it is bad for a person to die earlier than that yet not significantly better to live beyond it. The metaphor might be that a human is like a cup of limited capacity, and once it’s been filled up with life there’s no value to keep pouring.
iv. Full cup. One might hold that it is unfortunate for somebody to die before the age of approximately seventy, but somebody who lives much beyond seventy is not thereby significantly better off, since they’ve already had a full life.[17]
This stance would have four relevant implications. First, it would reduce the value of AGI success, because some of the supposed upside consisted of the (exponentially time-discounted) value of lifespans much longer than the currently typical one for humans. (However, another part of the upside—the prospect of a greatly improved quality of life—would remain important.) Second, it would tilt the prioritarian skew in favor of the young, since they are not guaranteed in the pre-AGI default condition to reach the “full cup” number of life years that the old have already attained, thus making the young count as more unfortunate, thus giving their interests (which favor longer timelines) greater weight. Third, it would increase the downside for the young of early AGI launch, since—unless the risk has been brought down to quite a low level—an AGI launch could amplify the threat that the young will fail to reach their normal allotment of years. And fourth, since this increased downside pertains exclusively to the young, whereas the old, according to (iv), have little to lose from an AGI launch as they are already home and dry, it would tilt prioritarian concern even further towards favoring the interests of the young. The upshot would be that optimal AGI timelines, if one adopted the “full cup” stance, would become significantly longer.
However, even if the “full cup” stance might have some prima facie appeal, it is plausible that the intuitions that appear to support it are rooted—at least in substantial part—in a conflation between chronological age and contingently associated circumstances of age. In contemporary settings, old age is associated with multimorbidity, declining capacities, loneliness, pain, loss of autonomy, a sense of being a burden, and bleak future prospects. It would hardly be remarkable if additional life years under those conditions have limited appeal to many.[18] This might lead one to believe that seventy years (or some “normal lifespan” in that neighborhood) is all we need to max out our utility function in life years. But the most it would really show is that in present circumstances we gain little from living much beyond that age. In other circumstances, we may gain a lot. In particular, if an AGI-breakthrough enables the restoration of full health and youthful vigor, and a return or even strengthening of our previously lost capacities—and pulls open the curtains to a long continued existence, together with friends and family who can also expect to stick around for a long time, in a world that is dawning on a new age, immeasurably richer, more promising, and teeming with marvels than any earlier era—then why should additional life years stop being valuable for somebody just because seventy life years have passed since they were born? In such a scenario, would we not rather all be like children again—with the potential before us so greatly outstripping our comparatively paltry past?
This suggests that we should reject the “full cup” stance as a fundamental evaluative principle, and specifically reject its application in the context of transformative AI, where many of the usual conditions of life years at old age are stipulated not to obtain. It is also worth noting that even under current (often very bad) conditions, those who seem best placed to judge the value of continued life at old age—namely, those who actually are in that situation and have first-hand knowledge of what it is like—often deny the stance and place a high value on remaining alive longer. For example, in one multicenter study of hospitalized patients aged 80+, more than two-thirds were willing to give up at most one month of a remaining year for “excellent health”.[19] Surrogate decision-makers systematically underestimated their reluctance to trade away time. When patients who were still alive a year later were asked the same question again, they were willing to trade even less time for better health than at baseline.
We have focused on distributional considerations that are fairly directly tied to when AGI is developed. There are of course many other potentially important distributional considerations that arise in the context of AGI. For example, citizens of a country that leads AGI development might benefit more than citizens of other countries; and individuals who directly participate in a successful AGI launch might gain disproportionate profits and glory. Although who and how may be correlated in various ways to when, these broader distributional questions fall outside the scope of this paper.
Other-focused prudential concerns
A different set of considerations arises if we expand our conception of what might lie in the prudential interest of a person to include the welfare of other persons they strongly care about. For example, while it might be in the narrow self-interest of an old person for superintelligence to be launched very soon, they might prefer a somewhat delayed launch because they also care about their grandchildren who have a much longer remaining life expectancy under pre-AGI conditions than they themselves do.
However, if we take into account these kinds of preferences, we should also take into account preferences going in the other directions: younger people who, for their own part, might benefit from longer timelines yet may prefer somewhat shorter timelines because they care about others who are closer to dying. Just as we can love our children and grandchildren, we can also love our parents and grandparents. So this type of concern for kin might total up to roughly a wash.
With regard to caring for our friends (or admired strangers), it is likewise unclear which way the correlation goes between somebody’s age and the number of people who care about them. The very old may have fewer people who care about them because many of their friends have already died; but the very young may also have fewer friends who care about them because they have not met many people yet or have not known them for long.
On a prioritarian view, including other-focused concerns among our prudential interests might induce a slight shift in the direction of longer timelines. Suppose we assume a symmetric degree of average care between the young and the old. Suppose, further, that the old are on average worse off than the young in the default condition (because of their shorter remaining and total life expectancy); so that a prioritarian reckoning upweights the interests of the old in determining the optimal social policy. Then the prioritarian upweighting of the interests of the old means that the interests of those whom the old care about receive extra weight (relative to what they would get if we didn’t include other-focused concerns in our conception of what is prudentially desirable for somebody). Since on average the people whom old people care about are younger than they are themselves, this would shift some emphasis towards younger people, whose interests are served by longer timelines. Any such effect, however, is quite subtle and second-order.
Theory of second best
We have thus far asked the question about the optimal timing for superintelligence (from a person-affecting perspective) in an abstracted way—as if the world had a knob for different dates and your job was to turn it to the correct setting. In reality, the situation is more complex. Nobody has full control over AGI timelines, and different actors have different preferences. The ideal timing may not be achievable, or might be achievable only through methods that would carry a significant risk of making the timing much worse than it would otherwise have been. Furthermore, interventions aimed at influencing when superintelligence arrives may have other important consequences besides their effect on timing. For these reasons, while the preceding discussion highlights some relevant background considerations, it does not on its own imply particular policy recommendations.
While a full policy analysis would require bringing into consideration many facts and arguments that are out of scope for this paper, it may be useful to briefly list some of the ways that an AI pause, or efforts to bring about such a pause, could have undesirable effects (aside from simply delaying the arrival of the benefits that successful AGI could bring):
The pause occurs too early. People conclude that it was pointless, and become less willing to pause later when it would have been useful.
The call for a pause results in poorly designed or incomplete regulation, producing safety theater that adds costs and bureaucracy and slows useful applications, while doing nothing to reduce the real risks. Compliance and box-ticking crowd out substantive work on risk reduction.
A pause is implemented, but the developments it aims to forestall continue anyway—just elsewhere. Work may be driven underground, or shift towards less scrupulous actors or less cooperative states.
The pause has an exemption for national security, pushing AI activities away from the civilian into the military sector. The result may be greater emphasis on destructive uses, lower transparency and democratic oversight, amplified AI-assisted coup risk or power concentration risk, and perhaps less competent alignment efforts.
There are calls for a pause but they go unheeded—and no catastrophe occurs. Those who warned of danger are discredited, making it harder for future calls for AI safety work to be taken seriously.
The push for a pause highlights the strategic importance of the technology, intensifying geopolitical AI competition.
An international agreement is reached on pausing, but this creates a prisoner’s dilemma in which some parties cheat (driving developments into covert programs) or triggers geopolitical conflict when some countries accuse others of cheating.
A pause is implemented, leading to economic recession and general pessimism and lowered hopes for the future. People see the world more as a zero-sum battle for a limited set of resources, increasing conflict and tribalism.
A pause prolongs the period during which the world is exposed to dangers from applications of already developed levels of AI (and to risks independent of AI), which more advanced AI could have helped mitigate.
To enforce a pause, a strong control apparatus is created. The future shifts in a more totalitarian direction.
There is a pause on AI development, yet progress in hardware and algorithm development continues. When the pause is eventually lifted, there is a massive compute and/or algorithm overhang that leads to explosive advances in AI that are riskier than if AI had advanced at a steadier pace throughout. The world will also not have had the opportunity to learn from and adapt to living with weaker AI systems. (Or in a more extreme case, the pause holds until dangerous models or superintelligence can be implemented on consumer-grade hardware, making it ungovernable.)- Agitation for a pause leads to extremism. Some people become radicalized or violent. Attitudes towards AI become polarized to such an extent as to make constructive dialogue difficult and destroy the ability of institutions to pass nuanced adaptive safety policy.
The push for a pause galvanizes supporters of AI to push back. Leading AI firms and AI authorities close ranks to downplay risk, marginalizing AI safety researchers and policy experts concerned with AI risk, reducing their resourcing and influence.A pause, initially sold as a brief moratorium to allow social adjustments and safety work to catch up, calcifies into a de facto permaban that prevents the immense promise of superintelligence from ever being realized—or is indefinitely extended without ever being formally made permanent.[20]
Of course, there are also some potentially positive side effects that might come from calls to bring about a pause even if they fail in their main aim. For example, they might lead to an increase in funding for AI safety work as a more acceptable alternative to pausing, or generally stimulate the world to more seriously prepare for AGI. Still, the potential ways that pausing or pushing for pausing could backfire are many and quite plausible.
The profile of potential upsides and downsides of a pause or delay looks different depending on the mechanics of implementation and the context in which it takes place. We have already touched on the idea that the safety benefit of a pause of a given duration seems likely to be much greater if it occurs at a late stage—ideally, once the capacity for AGI exists, and perhaps even a fully implemented system, yet prior to maximum scaleup or general deployment; since extra time for safety testing, oversight, and final adjustment may be especially impactful during that stage. The scope of and causal process inducing the pause is also relevant. Consider the following cases:
Frontrunner unilaterally burning lead. At the time when AGI becomes possible, one developer might have a technological lead over its competitors. It could choose to burn some or all of its lead to implement extra precautions while remaining ahead. This type of pause is relatively attractive, as it has less risk of producing many of the downsides listed above. It does not rely on the creation of a regulatory apparatus or enforcement regime, and it is less likely to result in a permanent abandonment of superintelligence. The pause is self-limiting, as it expires once a competitor catches up. If the case for additional safety precautions is very clear and strong, this competitor may also be persuaded to agree to halt (either unilaterally or in coordination with the frontrunner, perhaps with some nudging from the government), thus extending its duration. But eventually, as more competitors reach similar capability levels, the pause naturally expires. The scope for this kind of pause, however, is reduced in a highly competitive environment. At present, it is unclear who is ahead; and whatever lead they have is measured in a small number of months.
Government-imposed moratorium. This brings in more of the potential failure modes and side-effects that we listed. Risks of bureaucratization, militarization, self-coups, etc. are increased. The maximum duration of the pause is extended, and there is a greater risk that it would remain in place for longer than it ought to. It matters how the government action was brought about: if it is the result of technocratic pragmatics, the risk of it becoming too long or permanent is lower than if it comes about as a result of a general political anti-AI mobilization that stigmatizes the very idea of superintelligence. Instead of an outright moratorium, there could be regulation that permits the development and deployment of AGI only when safety standards have been met—this might be theoretically superior to an outright ban, but in practice it could be difficult to specify sensible criteria with enough precision.
Internationally agreed prohibition. Since this would involve state interventions, it would bring in many of the failure modes of a government-imposed moratorium. If the international agreement prohibits all development of new frontier systems, and includes effective verification provisions, it might avoid some of the risks (such as militarization and self-coups) that may be amplified in the case of individual government-imposed moratoria that have carveouts for national security applications. Other risks would be amplified, especially the risk that the moratorium ossifies into a permanent relinquishment of advanced AI, since in a tightly enforced global regime there would be no place where AI development could continue. The enforcement regime itself might also present some risk of eventually leading towards some sort of global totalitarian system. Yet without tight global enforcement, we would instead face the risks of selection effects, where AI development continues but only in the least cooperative states who refuse to join or in covert programs operated by defecting signatories. More limited international agreements on safety standards or short pauses might reduce some of these risks: for example, if AI projects in the U.S. and China are running neck-to-neck when dangerous AI systems are about to be developed, there may be little opportunity for a unilateral pause (of the “frontrunner burning lead” type); but some pragmatic cooperation might be possible, in which both parties agree to suspend large training runs for a finite period of time (perhaps with provisions for inspectors to verify that their biggest AI centers are idle) to allow some additional time to work out critical safety issues before resuming.
These are the merest schematics. In reality, policymakers will confront a more complicated and textured set of options, subject to many practical constraints, and in which the effect on AI timelines is only one of many consequences that need to be factored into decisions. While some of the variables may be analyzed abstractly and ahead of time, much of the essential context will only become evident as developments unfold, and will require continuing judgment calls to adjust policies to an evolving situation.
The analysis of optimal AI timelines is relevant not only to questions of whether or not to bring about an AI pause but also to other policy choices that could impact the pace of AI development and deployment. For example, chip export restrictions, taxes on data centers, or employment laws that make it harder to lay off workers are possible measures that may be proposed or rejected mainly for reasons other than their impacts on AGI timelines. Nevertheless, they would likely retard AI progress on the margin; and so, in evaluating such policies, it would be useful to know whether that effect would be desirable or undesirable.
Conclusions
We have examined optimal timing for superintelligence from a person-affecting perspective, focusing on mundane considerations, leaving aside arcane considerations and impersonal perspectives for future work. A basic point here is that the baseline is not safe—not only because there are other catastrophic risks besides AI but also because of the high rate of individual sickness and death under the status quo. The appropriate analogy for the development of superintelligence is not Russian roulette but surgery for a serious condition that would be fatal if left untreated.
A simple go/no-go model illustrated how, if aligned superintelligence would enable major life extension and quality-of-life improvements, then even very high levels of can be worth incurring in terms of quality-adjusted life expectancy.
Note that here refers to the probability of AI causing human extinction.[21] The highest tolerable probability of misaligned superintelligence could be even higher—plausibly as high as 100% with the given assumptions—since it is far from certain that all humans would die if misaligned superintelligence is deployed.[22]
We then proceeded to explore a series of models in which the decision-maker has a richer option set involving when to deploy superintelligence, rather than just the binary choice between deploying it immediately or never. Waiting can reduce catastrophic risk through safety progress, but incurs costs of ongoing mortality and foregone (or temporally discounted) benefits. A robust qualitative pattern emerges. Long waits are favored only when initial risk is very high and safety progress falls within a specific intermediate range—fast enough that waiting yields meaningful risk reduction, yet slow enough that the job isn’t done quickly anyway. Outside this conjunction, optimal delays tend to be modest.
Various robustness checks shift recommendations in predictable directions without overturning the basic result. Simply adding temporal discounting pushes toward later launch by downweighting far-future benefits, though it rarely produces very long delays unless the rate is quite high. Adding quality-of-life uplift pushes toward earlier launch, though this effect saturates: once post-AGI life is sufficiently attractive, pre-AGI life contributes little to expected value, and the main concern becomes simply reaching the post-AGI era. When quality-of-life uplift is present, the effect of temporal discounting can be reversed: for sufficiently large quality-of-life differentials, temporal discounting pushes towards earlier launch, as impatience penalizes the delay of the onset of that higher-quality existence. Finally, diminishing marginal utility in quality-adjusted life years makes the decision-maker more conservative, shrinking the region where immediate or early launch is optimal—but even substantial risk aversion does not radically alter the overall picture.
A more elaborate model was then introduced, which featured two timing variables: time until AGI capability exists (Phase 1, perhaps largely driven by technical difficulty), and any deliberate pause before full deployment once capability is attained (Phase 2). This matters because the rate of safety progress is unlikely to be uniform across stages. Once a deployable system exists, there is plausibly a “safety windfall”—the ability to study, probe, and stress-test the actual artifact, and to leverage its own capabilities to accelerate alignment work. Yet such gains face diminishing returns as the most tractable problems are solved. The upshot is that time early in Phase 2 purchases more safety per unit than equivalent time earlier or later. The multiphase model often recommends short but non-zero pauses—months or a small number of years—once AGI-ready systems exist.
Background conditions around the time of AGI capability also matter. If near-AGI systems destabilize the world through bioweapon proliferation, autonomous weapons, epistemic corrosion, or geopolitical escalation, the cost of waiting rises, favoring short and purposeful post-capability pauses. Conversely, a major non-AGI mortality reduction—especially effective anti-aging therapies—would lower the cost of waiting, making longer postponements potentially optimal.
We also considered a variation of the multiphase model where system risk is uncertain and tests can provide information. This changes the object of evaluation from an optimal launch date to an optimal policy: launch when evidence looks sufficiently favorable, delay when it does not. Safety testing can shorten or lengthen expected wait times, and can increase or decrease risk at launch, but in either case increases expected utility.
Prudentially optimal timing varies across individuals. The elderly and the ill face higher near-term mortality in the status quo; those with poor quality of life have less to lose and more to gain from a transition to potential post-AGI abundance. Those who are old, sick, poor, or miserable should therefore generally prefer earlier launch dates than those who are comfortable and secure. If policy incorporates prioritarian weighting, this shifts the global optimum toward shorter delays. Some intuitions about lifespan—such as the “full cup” notion that life-years beyond approximately seventy contribute little additional value—might push in the opposite direction; but we have argued such intuitions are plausibly misguided in a transformative-AI context, where many accustomed factors (such as the deprivations of old age) need not obtain.
These models have treated timing as if there were a simple knob to turn. In reality, no one has full control; different actors have different preferences; the ideal timing may be unachievable; and interventions aimed at influencing timelines have consequences beyond their effect on timing. Even if, in an abstract sense, a perfectly implemented pause before full superintelligence deployment would be desirable, there are numerous possible ways in which a bungled moratorium or other efforts to slow down AI developments could have bad effects in practice—for instance, by shifting developments to less regulated places, by increasing militarization, by creating hardware or algorithmic overhangs that ultimately make the AI transition more explosive, or by creating stigma and bureaucratization that risk ossifying into permanent relinquishment.
For these and other reasons, the preceding analysis—although it highlights several relevant considerations and tradeoffs—does not on its own imply support for any particular policy prescriptions. If nevertheless one wishes to compress the findings into a possible practical upshot, we might express it with the words swift to harbor, slow to berth: move quickly towards AGI capability, and then, as we gain more information about the remaining safety challenges and specifics of the situation, be prepared to possibly slow down and make adjustments as we navigate the critical stages of scaleup and deployment. It is in that final stage that a brief pause could have the greatest benefit.
Bibliography
Abellán-Perpiñán, J., Pinto-Prades, J., Méndez-Martínez, I. & Badía-Llach, X. (2006). “Towards a Better QALY Model”. Health Economics 15(7): pp. 665–676.
Amodei, D. (2024). “Machines of Loving Grace: How AI Could Transform the World for the Better”. https://www.darioamodei.com/essay/machines-of-loving-grace
Arias, E., Xu, J., Tejada-Vera, B. & Bastian, B. (2024). “U.S. State Life Tables, 2021”. National Vital Statistics Reports 73(6). (National Center for Health Statistics: Hyattsville, MD). https://www.cdc.gov/nchs/data/nvsr/nvsr73/nvsr73-06.pdf
Aschenbrenner, L. (2020). “Existential Risk and Growth”. Global Priorities Institute Working Paper No. 6-2020. https://globalprioritiesinstitute.org/leopold-aschenbrenner-existential-risk-and-growth/
Baumgartner, F. et al. Deadly Justice: A Statistical Portrait of the Death Penalty. (Oxford University Press: New York, 2017)
Binder, D. (2021). “A Simple Model of AGI Deployment Risk”. Effective Altruism Forum (9 July 2021). https://forum.effectivealtruism.org/posts/aSMexrjGXpNiWpbb5/a-simple-model-of-agi-deployment-risk
Bleichrodt, H. & Pinto, J. (2005). “The Validity of QALYs under Non-Expected Utility”. The Economic Journal 115(503): pp. 533–550.
Bostrom, N. (2003). “Astronomical Waste: The Opportunity Cost of Delayed Technological Development”. Utilitas 15(3): pp. 308–314.
Bostrom, N. Superintelligence: Paths, Dangers, Strategies (Oxford University Press: Oxford, 2014)
Bostrom, N. (2024). “AI Creation and the Cosmic Host”. Working paper.
https://nickbostrom.com/papers/ai-creation-and-the-cosmic-host.pdf
Christiano, P. (2023a). “Comment on ‘But Why Would the AI Kill Us?’”. LessWrong (17 April 2023). https://www.lesswrong.com/posts/87EzRDAHkQJptLthE/but-why-would-the-ai-kill-us?commentId=sEzzJ8bjCQ7aKLSJo
Christiano, P. (2023b). “Comment on ‘Cosmopolitan Values Don’t Come Free’”. LessWrong (31 May 2023). https://www.lesswrong.com/posts/2NncxDQ3KBDCxiJiP/cosmopolitan-values-don-t-come-free?commentId=ofPTrG6wsq7CxuTXk
Freitas, R. Nanomedicine: Volume 1: Basic Capabilities. (Landes Bioscience: Austin, Texas, 1999)
Grace, K. (2022). “Counterarguments to the Basic AI Risk Case”. World Spirit Sock Puppet (14 October 2022). https://worldspiritsockpuppet.substack.com/p/counterarguments-to-the-basic-ai
Greenblatt, R. (2025). “Notes on Fatalities from AI Takeover”. Unpublished manuscript.
Hall, R. & Jones, C. (2007). “The Value of Life and the Rise in Health Spending”. Quarterly Journal of Economics 122(1): pp. 39–72.
Harris, J. The Value of Life: An Introduction to Medical Ethics (Routledge: London, 1985). Chapter 5.
Houlden, T. (2024). “‘The AI Dilemma: Growth vs Existential Risk’: An Extension for EAs and a Summary for Non-economists”. Effective Altruism Forum (11 November 2024). https://forum.effectivealtruism.org/posts/9zzGKfSdMeL7bGoPC/the-ai-dilemma-growth-vs-existential-risk-an-extension-for
Hunt, T. & Yampolskiy, R. (2023). “Building Superintelligence Is Riskier Than Russian Roulette”. Nautilus (2 August 2023). https://nautil.us/building-superintelligence-is-riskier-than-russian-roulette-358022/
Jones, C. (2016). “Life and Growth”. Journal of Political Economy 124(2): pp. 539–578.
Jones, C. (2024). “The A.I. Dilemma: Growth versus Existential Risk”. American Economic Review 6(4): pp. 575–590.
Moravec, H. Mind Children: The Future of Robot and Human Intelligence (Harvard University Press: Cambridge, MA, 1988)
Parfit, D. (1997). “Equality and Priority”. Ratio 10(3): pp. 202–221.
Russell, S. (2024). Remarks at ITU AI for Good Summit Media Roundtable, Geneva, 18 April. https://www.itu.int/hub/2024/04/moving-ai-governance-from-principles-to-practice/
Sandberg, A. & Bostrom, N. (2008). Whole Brain Emulation: A Roadmap. Technical Report 2008-3. Future of Humanity Institute, University of Oxford. https://ora.ox.ac.uk/objects/uuid:a6880196-34c7-47a0-80f1-74d32ab98788/files/s5m60qt58t
Sanderson, W. & Scherbov, S. (2005). “Average remaining lifetimes can increase as human populations age”. Nature 435(7043): pp. 811–813.
Snell, T. (2021). Capital Punishment, 2020—Statistical Tables. NCJ 302729. Washington, DC: U.S. Department of Justice, Office of Justice Programs, Bureau of Justice Statistics.
Tsevat, J., Dawson, N., Wu, A., et al. (1998). “Health Values of Hospitalized Patients 80 Years or Older”. JAMA 279(5): pp. 371–375.
United Nations, Department of Economic and Social Affairs, Population Division (2024). World Population Prospects 2024. https://population.un.org/wpp/
Williams, A. (1997). “Intergenerational Equity: An Exploration of the ‘Fair Innings’ Argument”. Health Economics 6(2): pp. 117–132.
Wrigley-Field, E. & Feehan, D. (2022). “In a stationary population, the average lifespan of the living is a length-biased life expectancy”. Demography 59(1): pp. 207–220.
Yudkowsky, E. & Soares, N. (2025a). If anyone builds it, everyone dies: Why superhuman AI would kill us all. (Little, Brown and Company: New York)
Yudkowsky, E. & Soares, N. (2025b). “Why would making humans smarter help?” If Anyone Builds It, Everyone Dies. [Supp. online material] https://ifanyonebuildsit.com/13/why-would-making-humans-smarter-help
Appendix A: Details for the “timing and safety progress” model
Let denote the AGI launch time.
The pre-AGI annual mortality hazard is set to correspond to an average remaining life expectancy of 40 years. This yields a continuous hazard rate of:
If AGI is launched successfully, mortality is assumed to fall to a much lower value, corresponding to a life expectancy of 1,400 years:
The probability of catastrophic failure at launch declines with safety progress. If initial catastrophic risk at is and safety improves at annual fractional rate , then the continuous decay rate is:
and the launch-time catastrophe probability is:
Expected remaining life-years if AGI is launched at time are:
The optimal interior launch time is found by solving , yielding:
If the expression inside the logarithm is less than or equal to 1, then , meaning immediate launch maximizes expected remaining life-years. A positive exists only when initial catastrophic risk is high enough and safety improves fast enough that waiting reduces expected loss more than the background mortality accumulated during the delay.
Appendix B: Details for the “temporal discounting” model
To incorporate a constant pure time preference, we discount future life-years at rate . The expected discounted remaining life-years as a function of the AGI launch time is:
WRONG
where as in Appendix A.
Differentiating with respect to t and setting gives the interior first-order condition:
which rearranges to the threshold equation:
Solving for yields the optimal discounted launch time:
If the expression inside the logarithm is less than or equal to 1, then , so immediate launch maximizes expected discounted life-years. A positive interior solution exists only when initial catastrophic risk is sufficiently high and safety improves sufficiently quickly that waiting reduces expected discounted loss more than the additional background mortality incurred during the delay costs.
Tables B1–B3 show the results for different values of the pure temporal discount rate ().
TABLE B1: Low discount rate ()
| Safety Progress | 1% | 5% | 20% | 50% | 80% | 95% | 99% |
| No safety progress (0.0%/yr) | Launch asap | Launch asap | Launch asap | Launch asap | Never | Never | Never |
| Glacial safety progress (0.1%/yr) | Launch asap | Launch asap | Launch asap | Launch asap | Wait 300.4y | Wait 472.2y | Wait 513.4y |
| Very slow safety progress (1.0%/yr) | Launch asap | Launch asap | Launch asap | Wait 3.0y | Wait 49.7y | Wait 66.8y | Wait 71.0y |
| Moderate safety progress (10.0%/yr) | Launch asap | Launch asap | Wait 1.7y | Wait 10.4y | Wait 14.9y | Wait 16.5y | Wait 16.9y |
| Brisk safety progress (50.0%/yr) | Launch asap | Wait 7.1m | Wait 2.6y | Wait 3.9y | Wait 4.6y | Wait 4.8y | Wait 4.9y |
| Very fast safety progress (90.0%/yr) | Launch asap | Wait 8.2m | Wait 1.3y | Wait 1.7y | Wait 1.9y | Wait 2.0y | Wait 2.0y |
| Ultra-fast safety progress (99.0%/yr) | Wait 1.7m | Wait 5.9m | Wait 9.5m | Wait 11.9 m | Wait 1.1y | Wait 1.1y | Wait 1.1y |
TABLE B2: Medium discount rate ()
| Safety Progress | 1% | 5% | 20% | 50% | 80% | 95% | 99% |
| No safety progress (0.0%/yr) | Launch asap | Launch asap | Launch asap | Never | Never | Never | Never |
| Glacial safety progress (0.1%/yr) | Launch asap | Launch asap | Launch asap | Wait 142.3y | Wait 612.0y | Wait 783.8y | Wait 825.0y |
| Very slow safety progress (1.0%/yr) | Launch asap | Launch asap | Launch asap | Wait 29.1y | Wait 75.8y | Wait 92.9y | Wait 97.0y |
| Moderate safety progress (10.0%/yr) | Launch asap | Launch asap | Wait 2.6y | Wait 11.3y | Wait 15.8y | Wait 17.4y | Wait 17.8y |
| Brisk safety progress (50.0%/yr) | Launch asap | Wait 7.5m | Wait 2.6y | Wait 3.9y | Wait 4.6y | Wait 4.9y | Wait 4.9y |
| Very fast safety progress (90.0%/yr) | Launch asap | Wait 8.2m | Wait 1.3y | Wait 1.7y | Wait 1.9y | Wait 2.0y | Wait 2.0y |
| Ultra-fast safety progress (99.0%/yr) | Wait 1.7m | Wait 5.9m | Wait 9.5m | Wait 11.9m | Wait 1.1y | Wait 1.1y | Wait 1.1y |
TABLE B3: High discount rate ()
| Safety Progress | 1% | 5% | 20% | 50% | 80% | 95% | 99% |
| No safety progress (0.0%/yr) | Launch asap | Launch asap | Launch asap | Never | Never | Never | Never |
| Glacial safety progress (0.1%/yr) | Launch asap | Launch asap | Launch asap | Wait 447.5y | Wait 917.2y | Wait 1089.0y | Wait 1130.2y |
| Very slow safety progress (1.0%/yr) | Launch asap | Launch asap | Launch asap | Wait 55.7y | Wait 102.5y | Wait 119.6y | Wait 123.7y |
| Moderate safety progress (10.0%/yr) | Launch asap | Launch asap | Wait 3.8y | Wait 12.5y | Wait 16.9y | Wait 18.5y | Wait 18.9y |
| Brisk safety progress (50.0%/yr) | Launch asap | Wait 7.9m | Wait 2.7y | Wait 4.0y | Wait 4.7y | Wait 4.9y | Wait 5.0y |
| Very fast safety progress (90.0%/yr) | Launch asap | Wait 8.3m | Wait 1.3y | Wait 1.7y | Wait 1.9y | Wait 2.0y | Wait 2.0y |
| Ultra-fast safety progress (99.0%/yr) | Wait 1.7m | Wait 5.9m | Wait 9.5m | Wait 11.9m | Wait 1.1y | Wait 1.1y | Wait 1.1y |
Appendix C: Details for the “quality-of-life-adjustment” model
We generalize the objective function to maximize expected discounted quality-adjusted life-years (QALYs). Let and be the quality of life before and after AGI, respectively. The expected value as a function of launch time is:
Defining constants , , and , the integrated form simplifies to:
Differentiating with respect to and solving the first-order condition yields the optimal risk threshold :
The optimal launch time is derived by solving :
(If , then .)
The “launch asap” region expands as post-AGI quality increases, but it is bounded. As (implying ), the threshold approaches . Thus, even for an infinite prize, immediate launch is optimal only if the current risk is lower than this ratio. If risk exceeds this bound, it remains optimal to wait, as the probability of success improves through safety progress () faster than the value of the prize diminishes through mortality and discounting ().
The tables below illustrate this model. We first look at the case where a post-AGI lifeyear has a quality that is twice as high as a pre-AGI lifeyear () for low, medium, and high discount rates.
TABLE C1: Small quality difference (), low discount rate ()
| Safety Progress | 1% | 5% | 20% | 50% | 80% | 95% | 99% |
| No progress (0%/yr) | Launch asap | Launch asap | Launch asap | Launch asap | Launch asap | Never | Never |
| Glacial (0.1%/yr) | Launch asap | Launch asap | Launch asap | Launch asap | Wait 20.2y | Wait 192.0y | Wait 233.2y |
| Very slow (1%/yr) | Launch asap | Launch asap | Launch asap | Launch asap | Wait 21.9y | Wait 39.0y | Wait 43.1y |
| Moderate (10%/yr) | Launch asap | Launch asap | Launch asap | Wait 7.7y | Wait 12.2y | Wait 13.8y | Wait 14.2y |
| Brisk (50%/yr) | Launch asap | Wait 2.3m | Wait 2.2y | Wait 3.5y | Wait 4.2y | Wait 4.4y | Wait 4.5y |
| Very fast (90%/yr) | Launch asap | Wait 6.7m | Wait 1.2y | Wait 1.6y | Wait 1.8y | Wait 1.8y | Wait 1.9y |
| Ultra-fast (99%/yr) | Wait 29.2d | Wait 5.2m | Wait 8.8m | Wait 11.2m | Wait 1.0y | Wait 1.1y | Wait 1.1y |
TABLE C2: Small quality difference (), medium discount rate ()
| Safety Progress | 1% | 5% | 20% | 50% | 80% | 95% | 99% |
| No progress (0%/yr) | Launch asap | Launch asap | Launch asap | Launch asap | Never | Never | Never |
| Glacial (0.1%/yr) | Launch asap | Launch asap | Launch asap | Launch asap | Wait 122.2y | Wait 294.0y | Wait 335.2y |
| Very slow (1%/yr) | Launch asap | Launch asap | Launch asap | Launch asap | Wait 27.1y | Wait 44.2y | Wait 48.3y |
| Moderate (10%/yr) | Launch asap | Launch asap | Launch asap | Wait 6.7y | Wait 11.1y | Wait 12.8y | Wait 13.2y |
| Brisk (50%/yr) | Launch asap | Launch asap | Wait 1.9y | Wait 3.2y | Wait 3.9y | Wait 4.2y | Wait 4.2y |
| Very fast (90%/yr) | Launch asap | Wait 5.7m | Wait 1.1y | Wait 1.5y | Wait 1.7y | Wait 1.8y | Wait 1.8y |
| Ultra-fast (99%/yr) | Wait 12.8d | Wait 4.6m | Wait 8.2m | Wait 10.6m | Wait 11.8m | Wait 1.0y | Wait 1.0y |
TABLE C3: Small quality difference (, high discount rate ()
| Safety Progress | 1% | 5% | 20% | 50% | 80% | 95% | 99% |
| No progress (0%/yr) | Launch asap | Launch asap | Launch asap | Launch asap | Never | Never | Never |
| Glacial (0.1%/yr) | Launch asap | Launch asap | Launch asap | Launch asap | Wait 202.6y | Wait 374.4y | Wait 415.6y |
| Very slow (1%/yr) | Launch asap | Launch asap | Launch asap | Launch asap | Wait 31.4y | Wait 48.5y | Wait 52.6y |
| Moderate (10%/yr) | Launch asap | Launch asap | Launch asap | Wait 5.7y | Wait 10.1y | Wait 11.8y | Wait 12.1y |
| Brisk (50%/yr) | Launch asap | Launch asap | Wait 1.6y | Wait 3.0y | Wait 3.6y | Wait 3.9y | Wait 3.9y |
| Very fast (90%/yr) | Launch asap | Wait 4.6m | Wait 11.8m | Wait 1.4y | Wait 1.6y | Wait 1.7y | Wait 1.7y |
| Ultra-fast (99%/yr) | Launch asap | Wait 4.0m | Wait 7.7m | Wait 10.0m | Wait 11.3m | Wait 11.7m | Wait 11.8m |
For comparison, let’s also look at a version where post-AGI lifeyears are ten times as good as pre-AGI lifeyears (). Table C4 shows the case for a median discount rate.
TABLE C4: Large quality difference (, medium discount rate ()
| Safety Progress | 1% | 5% | 20% | 50% | 80% | 95% | 99% |
| No progress (0%/yr) | Launch asap | Launch asap | Launch asap | Launch asap | Launch asap | Never | Never |
| Glacial (0.1%/yr) | Launch asap | Launch asap | Launch asap | Launch asap | Launch asap | Wait 24.2y | Wait 65.4y |
| Very slow (1%/yr) | Launch asap | Launch asap | Launch asap | Launch asap | Wait 2.6m | Wait 17.3y | Wait 21.4y |
| Moderate (10%/yr) | Launch asap | Launch asap | Launch asap | Wait 4.1y | Wait 8.6y | Wait 10.2y | Wait 10.6y |
| Brisk (50%/yr) | Launch asap | Launch asap | Wait 1.5y | Wait 2.8y | Wait 3.5y | Wait 3.8y | Wait 3.8y |
| Very fast (90%/yr) | Launch asap | Wait 4.3m | Wait 11.5m | Wait 1.4y | Wait 1.6y | Wait 1.6y | Wait 1.7y |
| Ultra-fast (99%/yr) | Launch asap | Wait 3.9m | Wait 7.5m | Wait 9.9m | Wait 11.1m | Wait 11.6m | Wait 11.7m |
Appendix D: Details for the “diminishing marginal utility” model
To model risk aversion over (time-discounted quality-adjusted) lifespan, we employ two standard (one-parameter) utility functions from decision theory: Constant Relative Risk Aversion (CRRA) and Constant Absolute Risk Aversion (CARA).
1. Power Utility (CRRA)
The CRRA utility function—the one used in the main text—is defined as:
where represents the total discounted quality-adjusted life years (QALYs) and is the coefficient of relative risk aversion.
2. Exponential Utility (CARA)
The CARA utility function family takes the form:
3. Computation
For either functional form, we maximize the expected utility:
where:
4. Empirics
Direct estimates of utility for life duration in health‑economics/decision‑science settings have fit both power and exponential specifications. Exponential utility functions (CARA) for life duration have been directly estimated, but power utilities (CRRA) typically fit better.[23] We therefore treat power functions as the main specification, and include exponential function as a robustness check.
For , estimates typically find . From this derive :
Low: (corresponding to )
Medium: (corresponding to )
High: (corresponding to )
Because CARA exhibits constant absolute risk aversion, its relative risk aversion () scales with the value of the outcome. To match the empirical literature and make a fair comparison, we calibrate such that the local relative risk aversion matches the CRRA medium case () at the scale of the post-AGI “prize” (in discounted QALYs):
This yields .
5. Illustrations
Tables D1–D3 illustrate optimal launch times for the CRRA model, for the low, medium, and high value of , respectively. (Other parameters are the same as in Appendix C.)
TABLE D1: Diminishing marginal utility (CRRA, low rate)
| Safety Progress | 1% | 5% | 20% | 50% | 80% | 95% | 99% |
| No progress (0%/yr) | Launch asap | Launch asap | Launch asap | Launch asap | Never | Never | Never |
| Glacial (0.1%/yr) | Launch asap | Launch asap | Launch asap | Wait 1.7m | Wait 122.4y | Wait 294.0y | Wait 335.2y |
| Very slow (1%/yr) | Launch asap | Launch asap | Launch asap | Wait 11.8m | Wait 30.0y | Wait 45.5y | Wait 49.3y |
| Moderate (10%/yr) | Launch asap | Launch asap | Wait 1.8m | Wait 7.7y | Wait 11.9y | Wait 13.5y | Wait 13.9y |
| Brisk (50%/yr) | Launch asap | Wait 2.0m | Wait 2.1y | Wait 3.4y | Wait 4.1y | Wait 4.3y | Wait 4.4y |
| Very fast (90%/yr) | Launch asap | Wait 6.5m | Wait 1.1y | Wait 1.5y | Wait 1.7y | Wait 1.8y | Wait 1.8y |
| Ultra-fast (99%/yr) | Wait 25.8d | Wait 5.0m | Wait 8.6m | Wait 11.0m | Wait 1.0y | Wait 1.1y | Wait 1.1y |
TABLE D2: Diminishing marginal utility (CRRA, medium rate—same as in main text)
| Safety Progress | 1% | 5% | 20% | 50% | 80% | 95% | 99% |
| No progress (0%/yr) | Launch asap | Launch asap | Launch asap | Launch asap | Never | Never | Never |
| Glacial (0.1%/yr) | Launch asap | Launch asap | Wait 3.1d | Wait 1.9y | Wait 122.6y | Wait 294.0y | Wait 335.2y |
| Very slow (1%/yr) | Launch asap | Launch asap | Wait 4.2d | Wait 4.4y | Wait 31.7y | Wait 46.3y | Wait 50.1y |
| Moderate (10%/yr) | Launch asap | Launch asap | Wait 1.1y | Wait 8.4y | Wait 12.5y | Wait 14.1y | Wait 14.4y |
| Brisk (50%/yr) | Launch asap | Wait 4.4m | Wait 2.3y | Wait 3.6y | Wait 4.2y | Wait 4.5y | Wait 4.5y |
| Very fast (90%/yr) | Launch asap | Wait 7.2m | Wait 1.2y | Wait 1.6y | Wait 1.8y | Wait 1.9y | Wait 1.9y |
| Ultra-fast (99%/yr) | Wait 1.2m | Wait 5.4m | Wait 9.0m | Wait 11.3m | Wait 1.0y | Wait 1.1y | Wait 1.1y |
TABLE D3: Diminishing marginal utility (CRRA, high rate)
| Safety Progress | 1% | 5% | 20% | 50% | 80% | 95% | 99% |
| No progress (0%/yr) | Launch asap | Launch asap | Launch asap | Launch asap | Never | Never | Never |
| Glacial (0.1%/yr) | Launch asap | Launch asap | Wait 1.0m | Wait 4.4y | Wait 122.7y | Wait 294.0y | Wait 335.2y |
| Very slow (1%/yr) | Launch asap | Launch asap | Wait 1.3m | Wait 7.1y | Wait 33.0y | Wait 47.0y | Wait 50.6y |
| Moderate (10%/yr) | Launch asap | Launch asap | Wait 1.9y | Wait 9.0y | Wait 13.0y | Wait 14.5y | Wait 14.9y |
| Brisk (50%/yr) | Launch asap | Wait 6.4m | Wait 2.4y | Wait 3.7y | Wait 4.4y | Wait 4.6y | Wait 4.7y |
| Very fast (90%/yr) | Wait 1.7d | Wait 7.8m | Wait 1.2y | Wait 1.6y | Wait 1.8y | Wait 1.9y | Wait 1.9y |
| Ultra-fast (99%/yr) | Wait 1.5m | Wait 5.7m | Wait 9.2m | Wait 11.6m | Wait 1.1y | Wait 1.1y | Wait 1.1y |
Finally, Table D4 shows the corresponding medium case for the CARA utility function.
TABLE D4: Diminishing marginal utility (CARA, medium rate)
| Safety Progress | 1% | 5% | 20% | 50% | 80% | 95% | 99% |
| No progress (0%/yr) | Launch asap | Launch asap | Launch asap | Launch asap | Never | Never | Never |
| Glacial (0.1%/yr) | Launch asap | Launch asap | Launch asap | Launch asap | Wait 122.3y | Wait 294.0y | Wait 335.2y |
| Very slow (1%/yr) | Launch asap | Launch asap | Launch asap | Launch asap | Wait 28.8y | Wait 44.9y | Wait 48.8y |
| Moderate (10%/yr) | Launch asap | Launch asap | Launch asap | Wait 7.4y | Wait 11.7y | Wait 13.3y | Wait 13.7y |
| Brisk (50%/yr) | Launch asap | Wait 1.2m | Wait 2.1y | Wait 3.4y | Wait 4.1y | Wait 4.3y | Wait 4.4y |
| Very fast (90%/yr) | Launch asap | Wait 6.3m | Wait 1.1y | Wait 1.5y | Wait 1.7y | Wait 1.8y | Wait 1.8y |
| Ultra-fast (99%/yr) | Wait 23.3d | Wait 5.0m | Wait 8.6m | Wait 10.9m | Wait 1.0y | Wait 1.1y | Wait 1.1y |
6. Comparison between CRRA and CARA
Both functional forms of diminishing marginal utility / risk-aversion in time-discounted QALYs delay launch relative to the risk-neutral case (). Calibrated to the same reference scale and fit to the empirical literature, they give broadly similar timelines for the examined range of scenarios. However, because the relative risk aversion of CARA () rises with scale, CARA can be significantly more conservative than CRRA in high-value regions (with low temporal discount factor and large quality differential). Figure 5 shows the difference surface between the two functions.
Figure 5: Difference between CARA and CRRA (for the medium rate case)
Appendix E: Details for the “changing rates of progress” model
The basic ingredients are the same as in Appendices A–D: a pre‑AGI mortality hazard , a post‑AGI hazard , a pure time‑discount rate , quality weights and for life before and after AGI, and CRRA utility over discounted QALYs with curvature parameter .
We distinguish two timing variables. Let be the time from now until full AGI first becomes technically deployable (Phase 1), and let be any additional deliberate delay between that point and large‑scale deployment (Phase 2). AGI is launched at time
Let be the catastrophe probability if AGI were launched immediately. Safety work reduces this risk over time: over any sub‑interval in which the annual fractional reduction in risk is , we define the corresponding continuous decay rate:
If by time we have spent years in sub‑interval (capped at the maximum length of that sub‑interval), the cumulative risk reduction is:
The catastrophe probability at launch time is then:
Phase 1 runs from time 0 to with some baseline rate of safety progress. Once AGI‑ready systems are available, we model a “safety windfall” by splitting Phase 2 into four subphases with front‑loaded gains and diminishing returns: very rapid progress (2a), fast progress (2b), slower progress (2c), and an indefinitely long tail of very slow progress (2d). In each scenario, the first five columns (“Phase 1”, “2a”, “2b”, “2c”, “2d”) of the table specify the duration and annual fractional improvement rate used for these subphases.
For a given launch time , let denote the total discounted QALYs if AGI is successfully aligned at , and let denote the total discounted QALYs if launch at causes catastrophe so that only pre‑AGI life contributes.
With constant pre‑AGI hazard , post‑AGI hazard , and pure time discount rate , the pre‑AGI part is:
If launch succeeds at , the post‑AGI contribution is:
so
As in Appendix D, we use CRRA utility over discounted QALYs:
The expected utility from launching at is:
In the multiphase timing table we treat as fixed by the scenario (0, 5, 10, or 20 years until AGI availability). For each choice of initial catastrophe probability and each specification of baseline safety progress, we choose the pause length that maximizes
The optimal is what is reported in Table 8.
Table 9 reports results when the decision-maker can also accelerate Phase 1. We allow to be shortened by up to its full default duration (so that AGI could in principle become available immediately), while remains non-negative. The optimization problem becomes:
where safety progress during any acceleration of Phase 1 accrues at the Phase 1 rate, and the Phase 2 subphase structure (2a–2d) begins once AGI-capability is attained.
Appendix F: Details for the “shifting mortality rates” model
This extends the multiphase model of Appendix E by allowing the pre-AGI mortality hazard to change upon entering Phase 2. Let denote the mortality hazard during Phase 1, and let denote the hazard during Phase 2 (prior to launch). The discounted QALYs accumulated before launch become:
The post-AGI contribution and catastrophe probability remain as in Appendix E.
Appendix G: Details for the “safety testing” model
We keep the background assumptions from Appendices E–F (mortality hazards, discounting, CRRA utility over discounted QALYs, and the four post‑AGI subphases 2a–2d). At the moment AGI‑capable systems first exist (start of Phase 2), the true catastrophe probability at that instant is unknown. It is known only that it equals one of seven discrete “type”, , with a uniform prior over these seven possibilities.
From that point onward, conditional on each type, the catastrophe probability at time after AGI availability follows the same multiphase risk‑reduction schedule as in Appendix E. For each type this yields a deterministic risk path with
where is the cumulative integrated rate implied by the phase‑specific annual fractional reductions.
Starting from AGI availability, we perform a new test whenever cumulative risk reduction since the previous test reaches another 20 % factor. If the instantaneous risk at the time of a test is , the test output is:
“fail” with probability
“pass” with probability
Let be the current posterior probability that the system is of type and let be the corresponding instantaneous risk at the test time. After observing an outcome, we update by Bayes’ rule. For a pass,
and for a fail,
where is the normalisation constant that makes the posteriors sum to one.
Between tests, the posterior over types remains fixed, while each type’s risk level declines deterministically according to the multiphase schedule.
We treat the problem from the start of Phase 2 as a finite‑horizon POMDP. The state has two components:
Time within the multiphase schedule (which determines the phase and thus the risk‑reduction rate)
Belief state over the seven risk types
At each decision time (on a grid of size in the numerical implementation), the agent chooses between:
Launch now: terminate the process and receive utility , where is the discounted‑QALY objective from Appendices A–D for a launch at time with catastrophe probability .
Wait: advance time by (with deterministic change in the phase and risk levels) and, if a test is due, absorb the pass/fail signal and update the belief state by Bayes’ rule as above.
We solve this POMDP numerically by backward induction over the discrete time grid, using the underlying survival‑and‑QALY value function from the earlier timing models for the “launch” payoff. The result is an approximately Bayes‑optimal stationary policy mapping each time-belief pair to “launch” or “wait”.
For comparison, we also compute the best fixed‑pause policy with no testing. In that case, the agent chooses a single pause length after AGI availability, launches at in all worlds, and optimizes expected utility under the uniform prior over the seven types, exactly as in the multiphase model without testing.
- ^
For comments, I’m grateful to Owen Cotton-Barratt, Max Dalton, Tom Davidson, Lukas Finnveden, Rose Hadshar, Fin Moorehouse, Toby Ord, Anders Sandberg, Mia Taylor, and Lizka Vaintrob.
Yudkowsky & Soares (2025a). The authors propose a treaty of unlimited duration. Yet they seem to be in favor of eventually building superintelligence, after some presumably very long delay. They suggest the creation of a crack team of genetically engineered supergeniuses to help the planet safely navigate the transition (2025b). ↩︎
In the U.S., average survival time after an initial death sentence is about 22 years, and only 16% of death sentences are eventually carried out (Snell, T., 2021; Baumgartner et al., 2017). ↩︎
Cf. Freitas (1999), Bostrom (2014), and Amodei (2024). ↩︎
Sandberg, A. & Bostrom, N. (2008) ↩︎
E.g. Hunt, T & Yampolskiy, R. (2023) and Russell, S. (2024) ↩︎
There may of course not be a specific moment at which “superintelligence is launched”, but rather a more continuous and distributed process of incremental advances, deployments, and integration into the economy. But the structural considerations we point to in this paper can be seen more clearly if we consider a simplified model with a discrete launch event, and they should carry over to cases with more complicated deployment processes. ↩︎
Cf. Bostrom (2024) ↩︎
Previous work has mostly looked at the tradeoffs from the impersonal perspective. For example, Bostrom (2003) shows that even very long delays in technological development can theoretically be impersonally optimal if they lower existential risk. Hall & Jones (2007) point out that as societies get richer, the marginal utility of consumption falls rapidly while the value of additional life-years remains high, leading them to spend a larger fraction of GDP on life-extension (e.g. health spending). Jones (2016) argues that this “safety as a luxury good” mechanism can—depending on utility curvature—make it optimal to restrain economic growth or redirect innovation toward life-saving and safety. Aschenbrenner (2020) applies the mechanism to existential risk in a directed-technical-change model, suggesting that we are in a “time of perils” (advanced enough to build doomsday technologies but not yet rich enough to spend heavily on mitigation) and arguing that faster growth can shorten this phase and increase long-run survival even if it raises near-term risk. Binder (2021) presents a minimalist timing model trading accumulated background (“state”) risk against one-off superintelligence (“transition”) risk, with the optimum when the proportional rate of safety improvement equals the background hazard. Jones (2024) then studies a utilitarian planner choosing how long to run growth-boosting AI that carries a constant annual extinction risk; optimal run time is highly sensitive to diminishing marginal utility, and allowing AI-driven mortality reductions greatly increases tolerable cumulative risk. Houlden (2024) summarizes Jones and explores extensions adding non-AI growth and safety progress from pausing/investment. ↩︎
Global life expectancy at birth is roughly 73 years and the median age of the global population is a little over 30 years (United Nations, 2024): we round the difference to 40, for simplicity. In a later section we explore scenarios in which remaining life expectancy increases even without advanced AI. ↩︎
In developed countries, the annual mortality rate for healthy individuals aged 20–25 is approximately 0.05–0.08% per year, with most deaths in this age group attributable to external causes. If mortality were held constant at this rate throughout life, expected remaining lifespan would be approximately 1⁄0.0007 ≈ 1,400 years. See, e.g., Arias et al. (2024) for U.S. actuarial life tables; similar figures obtain in other developed countries. ↩︎
Sandberg & Bostrom (2008), Moravec (1988) ↩︎
Again, we’re restricting the discussion to mundane facts and considerations. (Otherwise the expected remaining lifespan may be infinite both with and without AGI.) ↩︎
These underlying factors in narrow prudential optimality need not be consistently reflected in stated preferences. One reason is that different groups may have different empirical beliefs, such as concerning how risky AGI is or how good post-AGI life would become. They may also have different beliefs about non-mundane considerations that are outside the scope of this investigation. Furthermore, people may care about other individuals—e.g. an old person with a beloved grandchild may prefer a less aggressive timeline than if they were concerned exclusively with their own prospects. People may also have non-person-affecting preferences, such as over possible future generations. Some might have idiosyncratic reasons (e.g. glory, profit, influence) for accelerating the creation of AGI. And people may of course also misunderstand what their rational interests are, or shade the expression of their preferences in light of social desirability norms. ↩︎
Parfit (1997) ↩︎
Cf. Sanderson & Scherbov (2005); Wrigley-Field & Feehan (2022) ↩︎
This can be compared to what is known in the bioethics literature as the “fair innings” view; see e.g. Harris (1985) and Williams (1997). But the latter is often focused on a comparative fairness intuition—that somebody who fails to attain the normal lifespan has been “cheated” of their fair share of years, and that individuals who would not otherwise attain this normal lifespan should therefore get priority in the allocation of healthcare resources. That view would presumably entail that if it became normal for humans to live to 500, then the fair innings would increase correspondingly. By contrast, what I call the “full cup” stance alleges that there is much less value to a person of an extra life year once they have lived for about seventy years. ↩︎
Tsevat, J. et al. 1998 ↩︎
Tvesat, Dawson, Wu, et al. (1998) ↩︎
One mechanism that could theoretically produce indefinite extension is hyperbolic discounting. People often discount imminent consequences far more steeply than distant ones. Consider someone who resolves to swim but balks at entering the cold water; fitting exponential discounting to this behavior would require a rate on the order of 50% per minute—absurdly high for other contexts. Applied to AGI: when the launch date arrives, we think “not today”, and repeat this reasoning each time the rescheduled date comes around. A structurally similar dynamic can arise even without individual time-inconsistency. If those with influence over deployment are always drawn from a demographic—e.g. neither very old nor very sick—that prudentially favors waiting decades, then when that future arrives, a new cohort may have taken their place with its own reasons for delay. While competitive pressures among multiple actors would probably prevent such indefinite procrastination, the dynamic becomes more concerning in scenarios involving a single dominant actor or a coordinated international body with broad discretion over timing. ↩︎
In a binary scenario—more generally, we could take Pdoom to be the expected fraction of the human population that dies when superintelligence is launched. ↩︎
See, e.g., Grace (2022), Christiano (2023a, 2023b), and Greenblatt (2025). ↩︎
Bleichrodt & Pinto (2005) estimate concave power and exponential forms for utility of life duration across health states. Abellán‑Perpiñán et al. (2006) find that a power model predicts best overall. ↩︎
The analysis depends on a combination of person-affecting stance with impoverished welfarist utilitarianism which I don’t find very persuasive or appealing, even taking aside the impersonal perspective.
Existing ordinary people usually have preferences and values not captured by the QALY calculation, such as wanting their kids having happy lives, or wanting the world not to end, or even wanting to live in a world which they understand.
Using the “undergo risky surgery” analogy, this analysis assumes the patient’s preferences have no place in the analysis, and if and when the surgery should happen should be decided by a utilitarian social planner.
The analysis hedges by “not supporting any particular policy prescriptions” but I do expect in practice to be quoted in informal motte-and-bailey way, where the bailey is “technically correct QALY calculation assuming away almost all moral and practical problems and having close to zero relevance for policy” and the motte is some vague sense that acceleration is desirable, the surgery metaphor, “swift to harbour” etc.
Yes the post explicitly considers things only from a mundane person-affecting stance, and I would not argue that this is the correct stance or the one I would all-things-considered endorse. However, it may be a component in a more plausible complex view, or a caucus in a ‘moral parliament’; so I think it is worth investigating what it implies. If ethics is complicated, we may need a divide and conquer strategy, where we isolate and analyze one element at a time.
I agree that people also have such preferences. Regarding people wanting their kids to have happy lives, the post does discuss that (under ‘other-focused prudential concerns’). Ceteris paribus, this pushes towards longer timelines being optimal. People might want their parents to have happy lives, which pushes in the opposite direction.
Preferences for not wanting the world to end: I think this would need to be discussed in the context of an analysis of which timelines are optimal from an xrisk-minimization perspective, which was (lamely) set aside for possible future work.
“live in a world they understand”—If this is something people want, it seems plausible AI could help a lot, by providing better explanations and perhaps cognitive enhancements. In the status quo, I think most technological devices (and to some extent our institutions) are, to most people, black boxes that offer somewhat understandable affordances. And even highly educated people are ignorant about the most fundamental aspects of how the world works, since we e.g. lack a theory of quantum gravity or a proper understanding of simulation theory and whatever other such ultimate parameters define reality.
I don’t think so. In the surgery example, the patient presumably gets to make the final decision; yet one may want to analyze the relevant tradeoffs to help inform their choice. In the case of AI, one can analyze the consequences for various interests or values of different choices that could be made—independently of who (or what institution) one thinks ultimately ought to make the decision. In any case, it seems likely that the outcome will be determined by processes that are not morally optimal or maximally legitimate; so the main question of interest may be how, on the margin, various stakeholders might wish to try to nudge things.
That is plausible. (This is also the case with much of my other writings, alas—I have no comparative advantage in being an ‘on message’ communicator; and I suspect any tiny specks of value there might be in my work would be washed away if I tried much harder to exercise message discipline.)
I do feel confused about the centrality of the person-affecting stance in this paper. My relationship to the person-affecting stance is approximately the same as the stance I would have to an analysis of the form “what should someone do if they personally don’t want to die and are indifferent to killing other people, or causing large amounts of suffering to other people, in the pursuit of that goal”. And my stance to that goal is “that is deeply sociopathic and might make a fun fiction story, but it obviously shouldn’t be the basis of societal decision-making, and luckily also isn’t”.
But when I read this paper, I don’t get that you relate to it anything like that. You say a bit that you are only doing this analysis from a person-affecting view, but most of the frame of the paper treats that view as something that is reasonable to maybe be the primary determinant of societal decision-making, and that just doesn’t really make any sense to me.
Like, imagine applying this analysis to any previous generation of humans. It would have resulted in advocating previous generations of humans to gamble everything on extremely tenuous chances of immortality, and probably would have long resulted in extinction, or at least massively inhibited growth. It obviously doesn’t generalize in any straightforward sense. And I feel like in order for the paper to leave the reader not with a very confused model of what is good to do here, that kind of analysis needed to be a very central part of the paper.
Isn’t CEV pretty much person-affecting view implemented? It’s not like you consider including dead people or future people in CEV or animals or aliens? They would receive consideration from preferences of people you do, but not directly.
I am here referencing person-affecting welfare-utilitarian views (this is pretty clear in the context of the paper, and also “person-affecting views” practically always refers to a subset of welfare-utilitarian views).
We could go into the tricky details of what CEV might be, or how the game theory plays into it, but the paper is referencing a much narrower moral perspective (in which the only things that matter are the experiences, not the preferences of the people currently alive).
Note that you could hold the view that the vast majority of people care mostly, even if not entirely, about the lives of people who currently exist: themselves, their immediate family, their children, and their friends. This is highly plausible when you consider that birth rates are crashing worldwide. Most people clearly prioritize their family’s material well-being over maximizing their future descendants who will be born many decades or centuries from now. Most people are not longtermists, or total utilitarians.
If this is the case, and I believe it is, then the welfare version of person-affecting views and the preference version largely coincide.
Yep, agree if people did not care about having children and the preferences of those children in the future, or about leaving a legacy to future humans, or about future generations, and in general were indifferent to any suffering or happiness to anyone not currently alive, then these two would coincide (but this strikes me as exceedingly unlikely).
People do care about having children, and they care especially strongly about their living children. But their concern for future unborn descendants, particularly in the distant future, is typically weaker than their concern for everyone who is currently alive.
I am certainly not saying people’s behavior is well-approximated by people caring about future people as much as they care about people today! Indeed, I would be very surprised if people’s caring factors much through welfare considerations at all. Mostly people have some concern about “the future of humanity”, and that concern is really quite strong. I don’t think it’s particularly coherent (as practically no ethical behavior exhibited by broad populations is), but it clearly is quite strong.
How would we test the claim that people have a strong concern about the long-term future of humanity? Almost every way I can think of measuring this seems to falsify it.
The literature on time discounting and personal finance behavior doesn’t support it. Across the world people are having fewer children than ever, suggesting they are placing less and less priority on having a posterity at all. Virtually all political debate concerns the lives of currently living people rather than abstract questions about humanity’s distant future. The notable exceptions, such as climate change, seem to reinforce my point: climate concern has been consistently overshadowed by our material interest in cheap fossil fuels, as evidenced by the fact that emissions and temperatures keep rising every year despite decades of debate.
One might argue that in each of these cases people are acting irrationally, and that we should look at their stated values rather than their revealed behavior. But the survey data doesn’t clearly demonstrate that people are longtermists either. Schubert et al. asked people directly about existential risk, and one of their primary findings was: “Thus, when asked in the most straightforward and unqualified way, participants do not find human extinction uniquely bad. This could partly explain why we currently invest relatively small resources in reducing existential risk.” We could also look at moral philosophers, who have spent thousands of years debating what we should ultimately value, and among whom explicit support for longtermism remains a minority position. This fact is acknowledged by longtermist philosophers like Hilary Greaves and William MacAskill, who generally emphasize that longtermist priorities are “neglected”, both within their field and by society at large.
I acknowledge that most people have some concern for the future of humanity. But “some concern” is not what we’re arguing about here. This concern would need to be very strong to override people’s interests in their own lives, such as whether they will develop Alzheimer’s or whether their parents will die. Even if people do have strong feelings about the future of humanity upon reflection, that concern is not “clear” but rather speculative. How could we actually know what people ultimately value upon reflection? In any case, the strong concern people have for their actual, living family is already pretty clear given the ordinary behavior that they engage in: how they spend their money, how many children they have, etc.
That, I suppose, depends strongly on whether one has or has not been fortunate. Threshold by my intuitive view is located around having accumulated enough resources to safeguard one’s AND one’s children future wellbeing/striving. Which is sooooooo stupid and sad to be happening on LW of all places. The asymmetry of mutual understanding between two groups goes again common sense though—i mean most fortunate ones should’ve had been the unfortunate ones in the past. Not so for us unfortunates. Fs should understand UFs mindsets better, but they seem not to. Like it’s the main thing of being LW—noticing our own biases, but Fs seem to have fallen victims of this self-directed warfare… I probably won’t be allowed to comment again this year—karma here bites—just in case anybody wonders))))
There might be a distinction here in considering CEV in near VS far mode. As this is one of the pretty strong considerations that would be included, I believe. Did you hope the CEV would be good by your lights? But you are just 1⁄8000000000 constituent of it, can go in many ways. And I’m not very sure if current (mixed) attitudes towards it would be amplified in one direction or another.
I think what he’s saying is that he and others have been promoting the idea of an impersonal longtermist view a lot over the past few years but that he has moral uncertainty and wants to consider other views. So he wrote a paper about the future of AI using a radically different perspective (the person-affecting view) even though he may not agree with it.
Though as you said if he really favors a more impersonal view then he could have done a better job at communicating that in the paper.
Yeah, and as I said, I think choosing the person-affecting view for this seems about as useful as choosing the “sociopath willing to kill every person in their path to get to their goal” point of view. I don’t understand this choice. It has obvious reductio-ad-absurdum cases.
And most importantly, the choice of ethical framework of course trivially overdetermines the answer. If your assumption is “assume humanity should gamble arbitrarily much on the immortality of the current generation” and “assume AI could provide immortality and nothing else can”, the answer of course becomes “humanity should gamble everything on AI providing immortality”. The rest is just fancy dress-up work.
Like, I think a persuasive or reasonable paper would have put its central load-bearing assumptions up front. It might still be worth chasing out the implications of the assumptions, but this is such a weird set of modeling assumptions, that explaining how sensitive the conclusion to this modeling assumption is, is the central thing a reader needs to understand when reading this. I think almost no reader would naively understand this, and indeed the conclusion seems to actively contradict the perspective, with most sentences not being phrased in the form “if you had belief X, then Y would make sense” but just directly phrased in pithy ways like “The appropriate analogy for the development of superintelligence is not Russian roulette but surgery for a serious condition that would be fatal if left untreated.”.
More up front than in the title?
Societal decision-making typically uses a far narrower basis than the general person-affecting stance that this paper analyzes. For example, not only do voters and governments usually not place much weight on not-yet-conceived people that might come into existence in future millennia, but they care relatively little about what happens to currently existing persons in other countries.
It’s not in the title, which is “Optimal Timing for Superintelligence: Mundane Considerations for Existing People”. My guess is you were maybe hoping that people would interpret “considerations for existing people”, to be equivalent to “person-affecting views” but that IMO doesn’t make any sense. A person-affecting assumption is not anywhere close to equivalent to “considerations for existing people”.
Existing people care about the future, and the future of humanity! If existing people (including me) didn’t care about future people, then the person-affecting view would indeed be correct, but people do!
Voters and governments put enormous weight on not-yet-conceived people! The average planning horizon for climate change regulation is many decades in the future. Nuclear waste management policies are expected to contain waste for hundreds of years. If anything, I think current governance tends to put far too much weight on the future relative to their actual ability to predict the future (as indeed, I expect neither nuclear waste nor climate change to still be relevant when they are forecasted to have large impacts).
It’s true that governments care less about what happens to people outside of their country, but that just seems like an orthogonal moral issue. They do very much care about their own country and routinely make plans that extend beyond the median life-expectancy of the people within their country (though usually this is a bad idea because actually they aren’t able to predict the future well enough to make plans that far out, but extinction risk is one of the cases where you can actually predict what will happen that far out, because you do know that you don’t have a country anymore if everyone in your country is dead).
Caring about future generations seems common, if not practically universal in policymaking. All the variance in why policymaking tends to focus on short-term effects is explained by the fact the future is hard to predict, not a lack of caring by governance institutions about the future of their countries or humanity at large. But that variance simply doesn’t exist for considering extinction risks. Maybe you have some other evidence that convinced you that countries and policy-makers operate on person-affecting views?
I am very confident that if you talk to practically any elected politician and ask them “how bad is it for everyone in the world to become infertile but otherwise they would lead happy lives until their deaths?”, their reaction would be “that would be extremely catastrophic and bad, humanity would be extinct soon, that would be extremely terrible” (in as much as you can get them to engage with the hypothetical seriously, which is of course often difficult).
Of course they don’t consistently operate on any specific moral view. But I would claim that they are less badly approximated by ‘benefit currently existing citizens’ than ‘neutrally benefit all possible future people (or citizens) that might be brought into existence over future eons’. Much less is spent on things like nuclear waste management and preventing climate change than on providing amenities for the current population. In fact, they may be spending a net negative amount of resources on trying to benefit future generations, since they are often saddling future generations with vast debt burdens in order to fund current consumption. (FHI—particularly Toby Ord—was involved in some efforts to try to infuse a little bit more consideration of future generations in UK policymaking, but I think only very limited inroads where made on that front.)
Yep, I am definitely not saying that current governance cares about future people equally as they do for current people! (My guess is I don’t either, but I don’t know, morality is tricky and I don’t have super strong stances on population ethics)
But “not caring equally strongly about future people” and “being indifferent to human extinction as long as everyone alive gets to spend the rest of their days happy” are of course drastically different. You are making the second assumption in the paper, which even setting aside whether it’s a reasonable assumption on moral grounds, is extremely divorced from how humanity makes governance decisions (and even more divorced from how people would want humanity to make policy decisions, which would IMO be the standard to aspire to for a policy analysis like this).
In other papers (e.g. Existential Risks (2001), Astronomical Waste (2003), and Existential Risk Prevention as a Global Priority (2013)) I focus mostly on what follows from a mundane impersonal perspective. Since that perspective is even further out of step with how humanity makes governance decisions, is it your opinion that those paper should likewise be castigated? (Some people who hate longtermism have done so, quite vehemently.) But my view is that there can be value in working out what follows from various possible theoretical positions, especially ones that have a distinguished pedigree and are taken seriously in the intellectual tradition. Certainly this is a very standard thing to do in academic philosophy, and I think it’s usually a healthy practice.
I am not fully sure what you are referring to by “mundane impersonal perspective”, but I like all of those papers. I both think they are substantially closer to capturing actual decision-making, and also are closer to what seems to me like good decision-making. They aren’t perfect (I could critique them as well), but my relationship to the perspective brought up in those papers is not the same as I would have to the sociopathic example I mention upthread, and I don’t think they have that many obvious reductio-ad-absurdum cases that obviously violate common-sense morality (and I do not remember these papers advocating for those things, but it’s been a while since I read them).
Absolute agree there is value in mapping out these kinds of things! But again, your paper really unambiguously to me does not maintain the usual “if X then Y” structure. It repeatedly falls back into making statements from an all-things-considered viewpoint, using the person-affecting view as a load-bearing argument in those statements (I could provide more quotes of it doing such).
And then separately, the person-affecting view just really doesn’t seem very interesting to me as a thing to extrapolate. I don’t know why you find it interesting. It seems to me like an exceptionally weak starting point with obvious giant holes in its ethical validity, that make exploring its conclusions much less interesting than the vast majority of other ethical frameworks (like, I would be substantially more interested in a deontological analysis of AI takeoff, or a virtue ethical analysis of AI risk, or a pragmatist analysis, all of which strike me as more interesting and more potentially valid starting point than person-affecting welfare-utilitarianism).
And then beyond that, even if one were to chase out these implications, it seems like a huge improvement to include an analysis of the likelihood of the premises of the perspective you are chasing out, and how robust or likely to be true they are. It has been a while since I read the papers you linked, but much of at least some of them is arguing for and evaluating the validity of the ethical assumptions behind caring about the cosmic endowment. Your most recent paper seems much weaker on this dimension (though my memory might be betraying me, and plausible I will have the same criticism if I were to read your past work, though even then, arguing from the basis of an approximately correct premise, even if the premise is left unevaluated, clearly is better than arguing from the basis of an IMO obviously incorrect premise, without evaluating it as such).
[didn’t read original, just responding locally] My impression is that often people do justify AGI research using this sort of view. (Do you disagree?) That would make it an interesting view to extrapolate, no?
I really disagree. See here (or some of Michael St Jules’ comments in the same thread) for why person-affecting views aren’t “obviously dumb,” as some people seem to think. Or just read the flow-chart towards the end of this post (no need to read the whole post, the flow-chart will give you the basics of the idea.) More relevantly here, they are certainly not selfish, and it reflects poorly on you to make that insinuation. People who dedicate much of their life to EA hold them sincerely as a formalization of what it means to be “maximally altruistic.” It’s just not at all obvious that creating new happy people when there’s suffering in the world is the altruistic thing to do, and you’re begging the question by pretending it’s universally obvious.
I think what’s a lot more fair as a criticism is Jan Kulveit’s point: that person-affecting views combined with only crude welfare utilitarianism—without even factoring in things like existing people wanting their children to survive or wanting humanity as a whole to survive (though maybe less so now with recent world events making more people disappointed in humanity) -- is a weird and unrepresentative combination that would amount to basically only acting on the views of selfish people.
(And maybe that’s what drove your harsh judgment and you’d be more lenient if the paper made person-affecting assumptions that still put some indirect value on humanity surviving through the step of, “if Oliver as an existing person strongly cares about humanity’s long-run survival, then on a person-affecting view that gives weight to people’s life goals, humanity surviving the long run now gets +1 votes.” Like, maybe you’d still think such a view seems dumb to you, but you wouldn’t feel like it’s okay to proclaim that it’s socially inappropriate for others to have such views.)
But even that—the combination of views Jan Kulveit criticized—seems defensible to me to write a paper about, as long as the assumptions are clearly laid out. (I haven’t read the paper, but I asked Claude to tell me the assumptions it’s based on, and Claude seemed to get it correct in 4 seconds.) Bostrom said the points in this paper could be a building block, not that it’s his view of all we should consider. This sort of thing is pretty standard in philosophy, so much so that it often doesn’t even need to be explicitly stated and proactively contextualized at length, and I think we should just decouple better.
Instead of saying things like “this is a bad paper,” I feel like the fairer criticism would be something more like, “unfortunately we live in an age of twitter were stupid influencers take things out of context, and you could have foreseen that and proactively prevented certain obvious misinterpretations of the paper.” That would be fair criticism, but it makes clear that the paper might still be good for what it aims to be, and it at least puts part of the blame on twitter culture.
On the substance-level, btw, one “arcane consideration” that I would put a lot of weight on, even on person-affecting views, is stuff like what Bostrom talks about in the Cosmic Host paper. (It matters on person-affecting views because other civs in the multiverse exist independently of our actions.) In that paper too I get weird accelerationist vibes and I don’t agree with them either. I think pretty strongly that this cosmic host stuff is an argument for quality over speed when it comes to introducing a new technologically mature civilization to the multiverse-wide commons. It’s pretty bad form to bring an antisocial kid to a birthday party when you could just take extra efforts to first socialize the kid. If a planet just recklessly presses “go” on something that is 80% or 95% likely to be uncontrolled Moloch-stuff/optimization, that’s really shitty. Even if we can’t align AIs to human values, I feel like we at least have a duty to make them good at the building of peaceful coalitions/it being an okay thing to add to the cosmic host.
Yep, by person-affecting views I here meant person-affecting welfare utilitarianism views. Sorry for the confusion! I don’t think what I said was super unclear in the context of the criticism of the paper (and even in general, as person-affecting view in my experience almost exclusively gets used in the context of welfare utilitarianism).[1]
Please read the paper before you criticize my criticism of it then! The paper repeatedly makes claims about optimal policy in an uncaveated fashion, saying things like “The appropriate analogy for the development of superintelligence is not Russian roulette but surgery for a serious condition that would be fatal if left untreated.”
That sentence has no “ifs” or “buts” or anything. It doesn’t say “from the perspective of a naive welfare utilitarian taking a person-affecting view, the appropriate analogy for the development of superintelligence is...”. It just says “the appropriate analogy is...”.
It’s clear the paper is treating a welfare utilitarian person-affecting view as a reasonable guide to global policy decisions. The paper does not spend a single paragraph talking about limitations of this view, or explains why one might not want to take it seriously. If this is common in philosophy, then it is bad practice and I don’t want it repeated here.
And I also don’t buy this is a presentational decision. I am pretty (though not overwhelmingly confident) that Nick does think that this person-affecting moral view should play a major role in the moral parliament of humanity, and that the arguments in the paper are strong arguments for accelerating in many worlds where risks are very but not overwhelmingly high. Do you want to bet with me on this not being the case? And I think doing so is making a grave mistake, and the paper is arguing many people straightforwardly into the grave mistake.
If you take a preference utilitarianism perspective, then I defend the optimal morality actually only cares about the extrapolated preferences of exactly me! Moral realism seems pretty obviously false, so a person-affecting preference utilitarianism perspective seems also pretty silly, though I do think that for social coordination reasons, optimizing the preferences of everyone alive (and maybe everyone who was alive in the past) is the right choice, but for me that’s a contingent fact on what will cause the future to go best by my own values.
I see why you have that impression. (I feel like this is an artefact of critics of person-affecting views tending to be classical welfare utilitarians quite often, and they IMO have the bad habit of presenting opposing views inside their rigid framework and then ridiculing them for seeming silly under those odd assumptions. I would guess that most people who self-describe as having some sort of person-affecting view care very much about preferences, in one way or another.)
That’s fair, sorry!
It bothered me that people on twitter didn’t even label that the paper explicitly bracketed a lot of stuff and laid out its very simplistic assumptions, but then I updated too far in the direction of “backlash lacked justification.”
I agree it would be a mistake to give it a ton of weight, but I think this view deserves a bit of weight.
Indirectly related to that, I think some of the points people make of the sort of “if you’re so worried about everyone dying, let’s try cryonics” or “let’s try human enhancement” are unfortunately not very convincing. I think that “everything is doomed unless we hail mary bail ourselves out with magic-like AI takeoff fixing it all for us” is unfortunately quite an accurate outlook. (I’m still open to being proven wrong if suddenly a lot of things were to get more hopeful, though.) Civilization has seemed pretty fucked even just a couple of years ago, and it hasn’t gotten any better more recently. Still, on my suffering-focused views, that makes it EVEN LESS appealing that we should launch AI, not more appealing.
To be clear, I agree that it’s a failure mode to prematurely rule things out just because they seem difficult. And I agree that it’s insane to act as though global coordination to pause AI is somehow socially or politically impossible. It clearly isn’t. I think pausing AI is difficult but feasible. I think “fixing the sanity of civilization so that you have competent people in charge in many places that matter” seems much less realistic? Basically, I think you can build local bubbles of sanity around leaders with the right traits and groups with the right culture, but it’s unfortunately quite hard given human limitations (and maybe other aspects of our situation) to make these bubbles large enough to ensure things like cryonics or human enhancement goes well for many decades without somehow running into a catastrophe sooner or later. (Because progress moves onwards in certain areas even with an AI pause.)
I’m just saying that, given what I think is the accurate outlook, it isn’t entirely fair to shoot down any high-variance strategies with “wtf, why go there, why don’t we do this other safer thing instead ((that clearly isn’t going to work))?”
If I didn’t have suffering-focused values, I would be sympathetic to the intuition of “maybe we should increase the variance,” and so, on an intellectual level at least, I feel like Bostrom deserves credit for pointing that out.
But I have a suffering-focused outlook, so, for the record, I disagree with the conclusions. Also, I think even based on less suffering-focused values, it seems very plausible to me that civilizations that don’t have their act together enough to proceed into AI takeoff with coordination and at least a good plan, shouldn’t launch AI at all. It’s uncooperative towards possibly nearby other civilizations or towards the “cosmic host.” Bostrom says he’s concerned about scenarios where superintelligence never gets built. It’s not obvious to me that this is very likely, though, so if I’m right that earth would rebuild even after a catastrophe, and if totalitarianism or other lock ins without superintelligence wouldn’t last all that long before collapsing in one way or another, then there’s no rush from a purely longtermist perspective. (I’m not confident in these assumptions, but I partly have these views from deferring to former FHI staff/affiliates, of all people (on the rebuilding point).)
While I disagree with your outlook[1], I agree that we shouldn’t dismiss high variance strategies lightly. I am not criticizing the paper on the grounds of the policy it advocates. If someone were to wrote a paper that had as shaky foundations, and treated those foundations with as little suspicion as this paper, I would react the same way (e.g. if someone wrote a paper arguing against developing AI for job loss reasons, without once questioning whether job loss is actually bad, I would object on similar grounds).
That is also a concern I have much more sympathy towards than this paper. I think it’s quite unlikely, but I can see the argument. I don’t feel that way about the arguments in this paper.
indeed, I think in the absence of developing AI we would quickly develop alternative, much safer technologies which would most likely cause humanity to very substantially become better at governing itself, and to navigate the future reasonably
Yes, although, as that paper discusses, speed may also be important insofar as it reduces the risk of us failing to add anything at all, since that’s also something the cosmic host may care about—the risk that we fail ever to produce superintelligence. (My views about those things are quite tentative, and they fall squarely into the ‘arcane’. I agree on their importance.)
Nick, I’m afraid that a faction[1] of your moral parliament may have staged a (hopefully temporary) coup or takeover, because if all of the representatives were still in a cooperative mood it seems like you’d probably have inserted at least a few more sentences to frame it differently to mitigate potential risks. You have enough people around you who would presumably be happy to help you with this even if you “have no comparative advantage” in it. (Comparative advantage is supposed to be an argument for trade, not an excuse for ignoring risks/downsides to your other values!)
perhaps a coalition of egoism, person-affecting altruism, and intellectual pursuit for its own sake
I agree with the concern generally, but I think we very much should not concede the point (to people with EPOCH-type beliefs, for instance) that AI accelerationism is an okay conclusion for people with person-affecting views (as you imply a bit in your endnote). For one thing, even on Bostrom’s analysis, pausing for multiple years makes sense under quite a broad class of assumptions (personally I think it’s clearly bad thinking to put only <15% on risk of AI ruin, and my own credence is >>50%). Secondly, as Jan Kulveit’s top-level comment here pointed out, more things matter on person-affecting views than crude welfare-utilitarian considerations (it also matters that some people want their children to grow up or for humanity to succeed in the long run even at some personal cost). Lastly, see the point in the last paragraph of my reply to habryka: Other civs in the multiverse matter also on person-affecting views, and it’s quite embarrassing and bad form if our civilization presses “go” on something that is 80% or 95% likely to get out of control and follow Moloch dynamics, when we could try to take more care and add a more-likely-to-be cooperative and decent citizen to the “cosmic host”.
I realise that ‘person-affecting’ is signposted here, but (especially as someone who considers such views to be tremendously mistaken, but generally as someone who values clear discourse), I really think it ought to be emphasised and clarified more.
Cryonics was mentioned, but nobody mentioned irony that if you replace P(doom) with P(cryonics doesn’t work), you get pretty good argument in support of cryonics, and if you account for the whole “possibly murdering everyone in a mad bid for immortality” business cryonics is clearly superior and progress in cryonics is non-glacial and we have alternative in form of formaldehyde fixation and we are likely to get mind uploading technology in 50 years, which gives us for free benefits of AGI without majority of downsides.
We have such good chances in getting all the universe, let’s not destroy them by rushing.
Making progress in cryonics or, better still, in longevity medicine, would be good ways to lengthen optimal [for existing people, from a mundane perspective] AI timelines.
With cryonics, the social obstacles seem formidable. My impression is that there’s at least a somewhat decent chance that current technology is already sufficient for successful preservation, and has been so for decades; yet uptake remains negligible. The discontinuity that suspension involves—in social participation etc. - also reduces its attractiveness.
With longevity medicine, uptake would be easier (although it would still be challenging to achieve a globally significant impact if treatments are expensive). So far, technical progress has been slow. Maybe there’s some hope that AI progress could accelerate this, even short of full general superintelligence—an additional reason for why, if there is to be a pause, it may be best for that pause to occur as late as possible.
There is also accumulating risks that our civilization gets destroyed before superintelligence. This includes xrisks. But also significant from a person-affecting perspective are scenarios of collapse or derailment that fall short of extinction or permanent loss of potential. For example, a big nuclear war or a bad engineered pandemic or a global breakdown of order could be devastating from a person-affecting perspective even if in the long-run humanity recovered.
If somehow we could be become both individually and collectively safe, then I think the person-affecting perspective would favor a much slower and more risk-averse pace of AI development.
I’d normally be wary of criticizing this, because it’s written by Bostrom, one of the earliest and clearest thinkers on AI risk. But I think the argument is wrong.
The argument compares “business as usual” (people living normal lives and then dying), “AI gives everyone longevity”, and “AI kills everyone”. But these are not the only possibilities. A neglected fourth possibility is that AI makes things much worse than just killing everyone. For example, if large numbers of people end up in inescapable servitude. I think such outcomes are actually typical in case of many near-misses at alignment, including the particular near-miss that’s becoming more probable day by day: if the powerful successfully align the AI to themselves, and it enables them to lord it over the powerless forever. To believe that the powerful will be nice to the powerless of their own accord, given our knowledge of history, is very rose-colored thinking.
For example, in one of the past threads someone suggested to me that since human nature contains nonzero altruism, some of the powerful people of the future will set up “nature preserves” where the powerless can live happy lives. When I pointed out that human nature also contains other nonzero urges besides altruism, and asked why most of the powerless will end up in these “nature preserves” rather than somewhere else run by a less-nice powerful person, I got no answer.
The economic rationale for human servitude disappears when the machines are better than humans at everything. That doesn’t prevent sadistic mistreatment or killing the poor to use their atoms for something else, but it’s a major disanalogy from history. What lessons you draw probably depend on whether you think the rich and powerful are sadistic (actively wanting to harm the poor) or merely mostly selfish (happy to help the poor if it’s trivially cheap or they get their name on a building in return, but not if it makes a dent in the yacht and caviar budget).
“Actively wanting to harm the poor” doesn’t strike at the heart of the issue. Nor is it about economics. The issue is that the powerful want to feel socially dominant. There have been plenty of historical examples where this turned ugly.
I’m maybe more attuned to this than most people. I still remember my first time (as a child) going to a restaurant that had waiters, and feeling very clearly that being waited-on was not only about getting food, but also partly an ugly dominance ritual that I wanted no part of. On the same continuum you have kings forcing subjects to address them as “Your Majesty”: it still kinda blows my mind that that was a real thing.
The powerful want to be socially dominant, but to what extent are they willing to engineer painful conditions to experience a greater high from the quality of life disparity? In a world with robots delivering extreme material abundance, this kind of is “actively wanting to harm the poor”. It’s true that some sadistically enjoy signs of disparity, but how much of that is extracting pleasure from the economic realities compared to it being the intrinsic motivation for the power?
I’m not sure on what the right way to model how this will play out, but my guess is that the outcome isn’t knowable from where we stand. I think it will heavily depend on:
The particular predispositions of the powerful people pushing the technology
The shape of the tech tree and how we explore it
The inequality is going to be so large that, as cousin_it said, the powerful will effectively have root-level access over the powerless. They can do anything. ANYTHING.
Vague theorizing about what these people’s motivations might be do not dissuade me from the notion that some of them are going to be sadistic. There is no universe in which this doesn’t turn basically maximally awful, at least in some regions of the universe.
And if you think the other powerful people will keep the sadists in check, even though the powerless are literally powerless, as in they have no means whatsoever to check their power even in a small way, or speak up against the wishes of their masters if their masters don’t allow it...
Then I have to ask you: How’s veganism doing?
I will believe in a benevolent superior species when I see one.
I actually agree that we should do whatever we can to prevent a few actors from having this kind of control, so I’m not aiming to dissuade anyone into complacency.
My comment was trying to say “I’m not entirely sold the current crop of tech leaders will go full AI-driven sadism. Many people go into Minecraft creative mode but then don’t torture the villagers.” I’m still not entirely convinced we should mainly expect it, but I saw this quote from Alex Karp which surprised and updated me more towards your/cousin_it’s take
“I love the idea of getting a drone and having light fentanyl‑laced urine spraying on analysts that tried to screw us.”
Personally, I did my share of torturing minecraft villagers in creative mode, so maybe I’m projecting to an extent, except that there absolutely are lots more people like me who can’t be trusted with anywhere near that level of power over actual people.
I see. I think you should write a post trying to imagine in detail the failure modes you foresee if AI is aligned to the rich and powerful. What happens to the masses in those worlds, specifically? Are they killed, tortured, forced to work as waiters, or what? I have “merely mostly selfish” psych intuitions, so when I imagine Sam Altman being God-Emperor, I imagine that being like “luxury post-scarcity utopia except everyone has been brainwashed to express gratitude to the God-Emperor Sam I for giving them eternal life in utopia”, which is not ideal, but still arguably vastly better than worlds (like the status quo) with death and suffering. If you’re envisioning something darker, I think being more concrete would help puncture the optimism of people like me.
Hmm hm. Being forced to play out a war? Getting people’s minds modified so they behave like house elves from HP? Selective breeding? Selling some of your poor people to another rich person who’d like to have them? It’s not even like I’m envisioning something specific that’s dark, I just know that a world where some human beings have absolute root-level power over many others is gonna be dark. Let’s please not build such a world.
My read of Bostrom’s intent is that s-risks are deliberately excluded because they fall under the “arcane” category of considerations (per Evaluative Framework section), and this is supposed to be looking simply at Overton Window tradeoffs around lives saved.
However, I think you could still make a fair argument that s-risks could fall within the Overton Window if framed correctly, ex. “consider the possibility your ideological/political enemies win forever”. This is already part of the considerations being made by AI labs and relevant governments in as simple terms as US vs. China.[1] Still, I think the narrower analysis done by Bostrom here is still interesting.
One might argue this is not a “real” s-risk, but ex. Anthropic’s Dario Amodei seems pretty willing to risk the destruction of humanity over China reaching ASI first, according to his public statements, so I think it counts as a meaningful consideration in the public discourse outside of mere lives saved/lost.
Fates worse than death are hardly arcane. They occur every day. Fates far worse than what is possible now are not any more arcane than the mentioned hypothetical ability to cure all disease and aging via cellular-level nanomedicine. In fact, the capability to inflict fates much, much worse than death on people is straight-up implied by the medical capabilities he’s imagining here.
The repeating motif in fantasy that fear-of-death makes wizards omnicidal has turned out to be weirdly prescient.
As one pushes into the tails of risks bc ones lifespan grows arbitrarily long, the logical conclusion is that one must control the entire universe in order to control all possible threats. Uncontrolled processes must eventually be curtailed. And a smart wizard sees this far enough in advance that they try to move for decisive strategic advantage now. The general trope is that they then fail to see the consequences of self modification corrupting the things they cared about anyway, which is also weirdly prescient, as it turns out that this really is a wicked problem, philosophically, computationally etc.
He sets aside the difference between oneself dying eventually and there literally being no recognizable posterity, which I think makes this text relatively uninteresting. A future with 0 humans or any kind of humanity, where some alien entity transforms this part of the universe in what would appear to be a horrible scar with unrecognizable values. Also sets aside literally everyone getting violently slaughtered instead of most dying peacefully at 80 years old or worse outcomes than death.
But even given the selfish perspective, I just sort of guess that trying to get such a huge amount of numbers out of a sort of contrived theory is just not a good idea. The numbers range from 0-1000 years, so I don’t know what to take from this. Plugging in my estimated numbers in Table 6 sort of gets me to somewhat correct seeming numbers, though I may not fully get what the author meant.
I think that all considered, there are much better choices than accelerating AI, such as improving human intelligence. Improved human intelligence would extent lifespan, would help us solve the alignment problem, would improve quality of life. We can also make investments into lifespan/quality of life research. Overall a much better deal than building unaligned ASI now.
I think this is sort of false. There are probably many low hanging fruit ways to increase longevity and quality of life and it is at least immaginable that we could get close-ish to immortality without AI. If we produce really smart human researchers they could extent lifespan by centuries allowing each person to take advantage of even more progress. Eventually, we might upload human consciousness or do something like that.
Also cyronics is an option
Interesting reflection. In my experience, many people do not share transhumanist views. A large portion of the human population appears very conservative on societal questions, particularly when it comes to transformative technology. This is obviously the case for many religious people, but also for less religious but educated profiles, who won’t hesitate to invoke the tropes of Prometheus, Icarus, the Tower of Babel, Frankenstein, and so on. Traditional wisdom warns against hubris, including regarding the pursuit of immortality (Gilgamesh and others).
While most of these conservative people are obviously in favor of safeguarding humanity’s survival, they don’t necessarily have an attraction to ASI and biological immortality, on the contrary, the prospect of such societal change can be an absolute repellent for them. It’s possible that this clashes with their preferences almost as much as the prospect of humanity’s end.
So my question is the following : When conducting reasoning like in this article, should we take as reference the preferences of a person committed to transhumanist causes, or should we instead reason from what seems to be reality, also taking into account the preferences of these numerous conservative people, regardless of what we might personally think ?
Seems ~correct[1] under selfish preferences, but if caring broadly about humanlike life (even just your kids or kids kids etc) this changes dramatically (as value could be realized later). Plus the possibility of resurrection via Cryonics or digital data reconstructions. Also, my estimates of progress and doom are well towards the end where long pauses are called for even just selfishly.
Somewhat worried this shifts people towards incorrectly rushing ahead due to missing some of the above parts of world-model, but respect the depth and detail of analysis.
oh other than 1400y seems pretty arbitrary, i’d mostly guess that post AGI life is vastly longer than that?
Besides cryonics, if you can “revive” someone by figuring out the exact parameters of our universe, simulating history, and thusly finding the people who died and saving them, this changes the calculus further, as now we need to consider extending the lifespan of everyone who ever lived.
Mind uploading, besides directly increasing lifespan, could also result in copies and branches of selves. I find it extremely difficult to reason about the utility of having N copies of myself.
It’s unclear to me if this possible, but there’s at least uncertainty for me here, when we talk about superintelligence.
There are a lot of things I can critique in this paper, but other people are doing that so I’m going to just bring up the bit I don’t see others mentioning.
Where are the probability calculations for potential biotech advancements as an alternative for hitting the immortality event horizon in the next 20, 30, 40 years?
You meticulously model eight scenarios of safety progress rates, three discount rates, multiple CRRA parameters, safety testing POMDPs… but treat the single most reasonable alternative pathway to saving people’s lives beside “build ASI as soon as possible and keep it in a box until it’s safe” (?!) as a sensitivity check in Tables 10-11 rather than integrating it into the main analysis with probability estimates to compare.
For a paper whose entire emotional engine runs on “170,000 people die every day, and will continue to until we launch ASI,” that seems like a glaring omission that has me scratching my head. I admit to only reading the paper over once, so maybe I missed it, but Claude didn’t find it either. And of course there’s cryonics, which doesn’t get so much as a mention.
Without those calculations, the idea that this paper was written from a “mundane person-affecting stance” seems false. It seems more accurate instead to describe it as centrally from a “60+ year old with cancer and no family” stance. That you acknowledge different demographics doesn’t matter if you’re computing their optimal timelines within the same model that handwaves away the chances of alternative life extension pathways.
Bostrom’s results seem very sensitive to deviations from a wholly person-affecting perspective. To investigate, I coded up the model from Appendix A with one modification: I supposed that, instead of being wholly self interested, people are willing to sacrifice 10% of life expectancy for the sake of all future generations.
My method was to calculate the launch time that is later than the optimal time-point according to a selfish view, but only so much that life expectancy is reduced 10% from the selfish optimum.[^1] This method is crude, but illustrates how rush-to-launch loses support if one walks mildly away from a person-affecting view.
For example, with 20% $P_{doom}$ and 10%/yr safety progress, the selfishly optimal launch time is 8 months (Bostrom’s Table 3), which offers you 1,120 years of life expectancy. If you are willing to sacrifice 10% of that life expectancy (leaving you with 1,008 expected years of life!) for future generations, you would wait 11 years before launch to help safety become established. More generally, all superintelligence launch times from Table 3 were delayed by at least 4 years (none were ASAP anymore) and many were delayed 10-20 years. The rush to superintelligence was ameliorated.
Last, I estimated delays under more sacrifice. If people are willing to lose half of life expectancy to help ensure the existence of future generations, then superintelligence launch times would be delayed by at least 28 years for all scenarios covered in Bostrom’s Table 3. Results are below. Further, for all cases with $P_{doom}$ of 80% or less, the life expectancies of those making the sacrifice would remain generous, exceeding 140 years for $P_{doom}$ of 80%, exceeding 349 years for $P_{doom}$ of 50%, and exceeding 550 years for $P_{doom}$ of 20% or less.
Table A. ASI launch delay by P(doom) and safety progress, offering 50% of life expectancy. The table includes the scenarios from Bostrom’s Table 3.
No progress
(0%/yr)*
Never
launch
Never
launch
Glacial
(0.1%/yr)
Never
launch
Never
launch
Very slow
(1%/yr)
Moderate
(10%/yr)
Brisk
(50%/yr)
Very fast
(90%/yr)
Ultra fast
(99%/yr)
* Note that the sacrifice is fruitless in this case, because there is no safety progress during the delay. Similarly, the sacrifice may not have reasonable justification in the ultra-fast case.
[^1]: To confirm my code’s correctness, I also recreated Bostrom’s Table 3. This revealed a typo in Table 3: For $P_{doom} = 0.95$ and safety progress of 1%, the launch time is listed as 14.3 years but should be about 31.4.
I’ve only read the abstract, intro, and conclusion, and look forward to reading in more depth later.
I wanted to criticise the central framing which seems implicit: either we build superintelligence (which can immediately solve near-arbitrary problems in medicine, governance, and other tech), or we don’t (in which case we have no hope of becoming wiser, more capable, or better coordinated).
This strikes me as a terribly false dichotomy, very pervasive. We can totally get really ambitious benefits from tech, including those involving AI, without the autonomy and unified generality usually connoted by ‘AGI’ and ‘superintelligence’! And there’s a virtuous cycle where each boost to our wisdom marginally reduces the risks of badly-judged gambles.
See AI for Human Reasoning for Rationalists for a brief expansion of this (and links to more).
Perhaps there are unconquerable obstacles (which would nonetheless be conquered by ASI) which I don’t see clearly enough. I would like to know them (I fear the proliferation of destructive means via AI, and perhaps only a sufficiently surpassing singleton, and only one generated via superintelligence, sovereign or otherwise, can overcome this).
Or perhaps this highly distributed and human-centred approach actually counts as (some form of) superintelligence on some views—that seems reasonable on first principles, though I think colloquially confusing.
yea we could and imo should just set out to grow more intelligent/capable as humans, instead of handing the world to some aliens (at least for now, but also maybe forever, tho it should remain possible to collectively reevaluate this later). this centrally requires quickly banning AGI development and somehow quickly making humanity generally act and develop more thoughtfully
Confused by (strong?) downvotes on this. What’s the sin? If you disagree, use the disagree buttons (and I’d love it if you explain why you disagree too)!
I appreciate this paper because—like what I suspect is true of Bostrom—I also put substantial weight on person-affecting views. In fact, I would go even further than Bostrom goes here. I think, in general, we should usually take actions that benefit the billions of people alive today, or people who will soon exist, rather than assuming that everyone alive today should get negligible weight in the utilitarian calculus because of highly speculative considerations about what might occur in millions of years.
I expect this argument will not be received well on LessWrong, because it violates a major taboo in the community. Specifically, it points out that pausing AI development would likely cause grave harm to billions of currently living people by delaying medical progress that advanced AI could otherwise accelerate. Those billions of people are not abstractions. They include the readers of LessWrong, their parents, and their other family members. Acknowledging this cost is uncomfortable, and the community tends to avoid giving it serious weight, but that does not make it any less real.
I have long appreciated Bostrom for prioritizing clear and careful analysis over merely providing superficial rationalizations of socially acceptable views, and I believe this paper is a good example of that.
I think you (and Bostrom) are failing pretty hard at distinguishing “person-affecting views” from “an individual who is over 60 years old and maybe has cancer” or similar.
If someone was actually making arguments specifically for the benefit of all the people currently alive today and next generation, I would expect very different ones from those in this paper. You could try to reasonably try to say that 96% chance of the world ending is acceptable from an 80 year old person who doesn’t care about their younger family or friends or others, but I don’t think it’s a serious argument.
For example, you would have to also do the math for the likelihood of biotech advancements that help currently living 40 year olds or 30 year olds hit the immortality event horizon, as an alternative scenario to “either race for AGI or everyone alive today dies.” If you don’t do things like that, then it doesn’t seem reasonable to argue that this is all in service of a perspective for those alive today vs “hypothetical people”… and of course the conclusion is going to be pretty badly lopsided toward taking high risks, if no other path to saving lives is seriously considered.
Separately, I think you’re straw manning pretty hard if you think Lesswrong readers don’t put serious weight on the lives of themselves, their parents, and their family members. A lot of people in this community suffer from some form of existential dread related to short timelines, and they are emotionally affected quite hard from the potential loss of their lives, and their family’s lives, and their children’s lives… not some abstract notion of “far future people.” That is often a part of their intellectual calculations and posts, but it would be a huge mistake to assume it’s the center of their lived emotional experience.
I suspect you either lack a clear understanding of the argument made in Bostrom’s post, or you are purposely choosing to not engage with its substance beyond the first thousand words or so.
Bostrom is not claiming that a 96% chance of catastrophe is acceptable as a bottom line. That figure came only from his simplest go/no-go model. The bulk of the post extends this model with diminishing marginal utility, temporal discounting, and other complications, which can push toward longer wait times and more conservative risk tolerance. Moreover, your specific objection, that he doesn’t consider alternative paths to life extension without AGI, is false. In fact, he addressed this objection directly in his “Shifting Mortality Rates” section, where he models scenarios in which non-AGI medical breakthroughs reduce background mortality before deployment, and shows this does lengthen optimal timelines. He also explicitly acknowledges in his distributional analysis that the argument differentially benefits the old and sick, and engages with that fact rather than ignoring it.
I find it frustrating when someone dismisses an argument as unserious while clearly not engaging with what was actually said. This makes productive dialogue nearly impossible: no matter how carefully a point is made, the other person ignores it and instead argues against a version they invented in their own head and projected onto the original author.
I’m sorry I’ve given the impression of not engaging with what was actually said. Let me try to say what I meant more clearly:
The Shifting Mortality Rates section asks: “If background mortality drops, how does that change optimal timing?” It then runs the math for a scenario where mortality plummets all the way to 1/1400 upon entering Phase 2, and shows the pause durations get somewhat longer.
What it doesn’t ask is: “How likely is it that background mortality drops meaningfully in the next 20-40 years without ASI, and what does that do to the expected value calculation?”
I expect the latter because it’s actually pretty important? Like, look at these paragraphs in particular:
Bostrom is explicitly acknowledging here that non-ASI life extension would be a game-changer. He says the optimal launch time “could be pushed out considerably,” even to 50 years. He acknowledges it could come from pre-AGI AI or independent medical progress. He even notes it doesn’t need to happen yet, just become foreseeable, to shift the calculus dramatically!
And then he just… moves on. He never examines the actual likelihood of it!
He’s essentially saying “if this thing happened it would massively change my conclusions” without then investigating how likely it is, in a paper that is otherwise obsessively thorough about parameterizing uncertainty.
Compare this to how he handles AI safety progress. He doesn’t just say “if safety progress is fast, you should launch sooner.” He models four subphases with different rates, runs eight scenarios, builds a POMDP, computes optimal policies under uncertainty. He treats safety progress as a variable to be estimated and integrated over.
Non-ASI life extension gets two paragraphs of qualitative acknowledgment and a sensitivity table. In a paper that’s supposed to be answering “when should we launch,” the probability of the single factor he admits would “push out [timing] considerably” is left nearly unexamined, in my view.
So when a reader looks at the main tables and sees “launch ASAP” or close to it across large swaths of parameter space, that conclusion is implicitly assuming near 0% chance of non-ASI life extension. The Shifting Mortality Rates section tells you the conclusion would change if that assumption is wrong, but never really examines why he believes it is wrong, or what makes him certain or uncertain.
Which is exactly the question a paper about optimal timing from a person-affecting stance should be engaging with, in my view.
Does that make more sense?
(I added a few remarks on this in my reply to quetzal_rainbow, although—sorry—nothing numerical.)
Appreciate the remarks. Would look forward to a numerical forecast breakdown if you ever have the time to tackle it.
What if the actions that benefits billions of people alive today is slowing down AI development?
I think this debate is oversimplifying the situation by focusing on the trade-off between two different factors:
Benefits to people currently alive such as better medicine
Harm to future people via extinction
The situation is more complex and involves:
Benefits to current people
Harms to current people
Benefits to future people
Harms to future people
Even if we focus solely on people currently alive, pausing or regulating AI progress could be net positive: although current people stand to benefit from scientific breakthroughs from AI, fast AI development also creates risks like mass unemployment, disruptions of elections, concentration of power, increasing inequality, and generally making it hard for governments to react to the situation. Also human extinction would negatively affect current people by curtailing their lifespan.
I doubt the race to build AGI is best explained by a desire to build AI that benefits the lives of people alive today or in the future.
Instead, a better explanation seems to be individuals, companies, or researchers wanting the prestige of developing breakthroughs, big tech companies simply trying to make a profit and, an arms race dynamic between AI companies because of a lack of coordination to control the rate of AI progress.
Delayed medical progress is not a “grave harm”. It is a forgone benefit.
If I get cancer and someone intervenes to prevent the cure from being developed before the cancer kills me, I think they harmed me. Even if they choose to call it a “foregone benefit”, I still died. That’s what matters to me, not how they choose to describe it.
Sure, assuming the development of your cure doesn’t have substantial negative externalities, which is the whole point of the AI debate. I understand that your stance is “the risks are not that high”, but it’s worth pointing out that this is really a core assumption that the rest of your position is based on.
I’ll freely admit that my case for acceleration depends in large part on the risk being low. But I want to separate two distinct arguments here. Many people have told me that acceleration would be unjustified even if the risk is low. Their reasoning is that the sheer number of potential future people creates an overwhelming moral obligation to prioritize bringing them into existence, and that this obligation outweighs the welfare interests of everyone alive today.
I think this longtermist moral argument fails on its own terms, independently of my views about risk. Giving each potential future person significant moral weight inevitably reduces the moral weight of every currently living person to something negligible, since >10^23 potential future people will always swamp anything on the other side of the equation. Billions of real, existing people effectively become a rounding error in the calculation. To me, any moral framework that treats the people alive right now as though they barely matter at all is not one worth taking seriously. It is a ghastly moral stance, and I would reject it even if I thought the risks of acceleration were higher than I actually believe them to be.
Of course, the outcome matters.
But you don’t sue the scientist who retired one year before they discovered the cure. You don’t sue the government agency who denied the grant. You’re right to be angry at them. But it’s not a harm.
You do sue the factory that emitted the carcinogen that gave you cancer. Because that is a harm.
If someone physically held a gun to a surgeon’s head and stopped them from saving your life, would you consider that a harm? I would. In the same way, if the government forcibly prevents AI companies from accelerating medical breakthroughs through AI pause regulations, I consider that a harm too. This is fundamentally different from a situation where someone simply chooses not to advance medicine on their own. In one case, progress is being actively blocked by force; in the other, someone is merely declining to contribute. The distinction between coercively preventing progress and passively not pursuing it matters a lot for assigning blame and naming harm.
Yes, if a surgeon is forced not to operate, the patient is harmed.
But if the surgeon decides to stop operating and lets the patient die on the operating table, that is also a harm. The patient can sue the surgeon!
If a scientist is forced to retire, that harms the scientist. But I don’t think that harms the potential beneficiaries of technologies the scientist would have discovered. They can’t sue.
In these cases, it’s not force that makes a harm.
How does it matter to my argument that, in your analogy, someone dies but we can’t sue the person responsible? I don’t see the relevance. My point is about whether the death constitutes a harm that we should try to mitigate, not about whether anyone can be held legally liable for it.
I concede that if policymakers pass regulations that delay medical progress and cause billions of deaths as a result, I won’t be able to sue them. I still intend to fight against those regulations.
I was sloppy last night: If someone dies, they do suffer a harm. I should be arguing that these acts are “not harmful”; i.e., the actor isn’t responsible, the disease is. I think you gathered my meaning, but sorry for not being clear.
What I’m objecting to is the language “would likely cause grave harm”, which implies that heavy regulation would do harm — would harm people — and implies that the regulators would be morally responsible for the harm. This improperly tries to put an extra burden on supporters of regulation, because there’s a higher bar for harmful policies than for policies that fail to avert harm.
There’s a real ethical distinction between harming someone and merely failing to help them (or failing to mitigate a harm). One piece of evidence for whether an act is considered harmful is whether the victim can sue for damages. There are other kinds of evidence:
In the absence of a functioning legal system, most people would agree it would not be ethical to take revenge on someone who forced a scientist to retire early (assuming justice had already been done with respect to the harm to the scientist).
People don’t have legal or moral rights to the fruit of scientists’ labor (except for labor that’s already been paid for with public funds).
If you ask who or what killed a sick person, most people would blame the disease, not anyone who slowed down scientific progress lately.
If you just want to argue that heavy regulation would fail to mitigate a harm that we should mitigate, you could just say that your preferred policy would mitigate a grave harm. Or you could say that heavy regulation carries a cost of human lives — which still involves a rhetorical move of making your preferred policy the default against which opportunity costs are assessed, but doesn’t make an extra moral claim about harm. (Bostrom is careful to use the word “cost” instead of “harm” here, it seems, for what it’s worth.)
I’ve also been thinking about the merits and drawbacks of such an approach. I’ve been referring to it as “the Tokyo Drift strategy”. Accelerate towards the edge of the cliff, then pull the handbrake and spin the wheel at the last possible second, sliding towards the edge of the cliff while accelerating in a new direction. In my mind’s eye I see the rear tire sending a cloud of dust and pebbles over the edge as it slides by, a fraction of an inch from destruction.
Not a reassuring vision, but it would certainly make for a dramatic historical recreation if we survive!
Naturally, if anyone did that with my entire family in their car, I would go to great strides to make sure they regretted doing that to my family.
Good name, though.
Why is brain preservation not even mentioned once? Saying “launch immediately” for 50% doom, 1%/year progress is absurd if you think ASI would have a high chance of being able to recover minds from preserved brains (and would in fact choose to recover them).
Also the 1400 years thing seems ~arbitrary and like it was picked such that you end up with anything happening in those tables and plots. You could have picked a million or a billion years, which would give “launch immediately” for all non-extreme settings of parameters under this model.
The ’1400′ number was indeed picked somewhat arbitrarily and merely to illustrate the point that our life expectancy goes up even for quite levels of AI risk. I thought this point was worth making because I’ve seen the opposite claim made or insinuated by some anti-AI advocates.
Later models in the paper take into account more factors—in particular, temporal discounting and diminishing marginal utility in QALYs. In these more full-fledged models, it is not the case that we get “launch immediately” for all non-extreme settings of the parameters even if we postulate that post-superintelligence lifespans could be a billion years.
(In general, as I said in the preamble, I recommend not focussing overly on the exact numbers that pop out of these simple models. The formal models are mostly intended to serve as illustrations of various possible reasoning assumptions and the general patterns they imply.)
Skimming the article, the basic tradeoff seems to be extreme longevity versus extinction. But the human race in general is attaching zero priority to extreme longevity as a goal. There is a scattered minority at all levels of society who would jump at the chance for 200-year or 1000-year lifespans, but it is a minority. If most ordinary people, or even most intelligentsia, wanted it, then our societies would give it some level of priority. But it is given no level of priority; it is actually viewed negatively. These days, if the topic comes up, it is mostly considered to be a neurotic desire of selfish alienated super-rich.
My question: among all the formal variations of the tradeoff considered in the article, is there one that can represent how the tradeoff looks, when significant life extension is assigned basically zero value?
That’s unfortunate. It seem like it would have been better for you to start with the optimal timing analysis from an impersonal perspective since an impersonal perspective seems much more plausible than a person-affecting perspective.
Do you think your analysis of optimal timing from the person-affecting view is useful even if person-affecting views are wrong?
Do you think an analysis of optimal timing from an all-things-considered moral parliamentary perspective that only gives some weight to person-affecting views as appropriate would come to a similar conclusion about optimal timing?
I asked Nick about the choice of theory of value for this paper, which I personally find quite counter to my intuitions. I suggested that perhaps a better theory of value would account for great cultural accomplishments in science, art, music, literature, etc. I, for instance, would trade a lot of “Willy Loman”-types for a single Leonard Euler.
He spoke somewhat dismissively of this idea, saying “if we survive, there will be plenty of time for guitars and crayons.”
I think this rather proves my point though. If we value having time for guitars and crayons, then we need to survive. Thus, it’s worth sacrificing a lot of current lives in order to improve the odds that humanity survives at all.
In the same discussion he said that he had explicitly avoided considering existential risk in this work, and that he intended to consider existential risk at some point in the future. Seems to me like this work is fairly meaningless without that most important consideration addressed.
Overall a disappointing paper, and disappointing responses.
Man, that abstract does not accurately represent the assumptions. Therefore, it wildly misrepresents the conclusions we should draw from this line of thinking.
Neglecting to say prominently “of course most people would consider this perspective utterly sociopathic” is failing to say the single most important thing about this piece. That’s quite dishonest.
Which is often the case with academic papers. But it’s not acceptable in rationalist circles, or anything more practical than the ivory tower.
The abstract says “developing AGI is like having a risky surgery for a condition that will eventually prove fatal”. True enough.
But if this particular “risky surgery” fails, in this case it also kills everyone else now living and thereby prevents every happy human who ever would’ve lived in subsequent generations from doing so.
Only a monstrous person would take this risk at high odds of failure. What parent would cost their children more years of life, let alone the chance to have children of their own? It’s not even remotely like the high-risk surgery analogy, which affects only the person (or even in the analogy, set of people) making the decision.
Kind of worth noting, wouldn’t you think?
What the hell, Nick? I thought you were an honest person.
I do hope to see an apology and explanation for the framing of this piece. I do not see it in the comments.
The content is fine, but public perception and therefore framing matters.
I wonder why we can assume that everyone gets a longer life. Despite a whole section on “distribution” the math is always that everyone has a longer life. But is this probable? Likely? Possible? So many things seem to stand in the way:
Differential access to post-AGI medical advances,
Elite capture of life-extension technologies,
National or geopolitical exclusion,
Class stratification in longevity,
Delayed diffusion of therapies,
Political economy of distribution.
It would be reasonable—or at least equivalent—to suggest that the only people who live 1400 years are the billionaires. 3,000 people. Making the math work out to an average life expectancy of 40.00005 years. Do we still want to risk it all?
You assume early death is the worst possibility, which is easy to do I suppose as long as you are in a stable and safe enough position yourself to not have to worry too much about the worst this world can offer, but this need not remain the case if a species more powerful than humans takes over, and also with such high technology, the worst this world can offer gets far worse.
Bostrom’s Footnote 21 seems innocuous, but to me it unravels a lot of the argument Bostrom is making.[1]
Bostrom’s central go/no-go model suggests a P(doom) of up to 97% is acceptable if life expectancy rises to 1,400 years post-AGI.
Footnote 21 clarifies, ``more generally, we could take P(doom) to be the expected fraction of the human population that dies when superintelligence is launched.″
So, suppose one could extend life 1,400 years for 3% of humans at the cost of killing 97% right now. How should we reply to this deal? Bostrom’s go/no-go model says to accept, but I think people would overwhelmingly find the deal morally reprehensible.
It’s straightforward to observe that the two deals, Bostrom’s and mine, are mathematically identical for the go/no-go model, which assumes as person-affecting framework. But I think something more subtle happens if we step slightly outside the person-affecting framework.
If you have even slight impersonal preferences, I think that you should decide Bostrom’s deal is strictly worse than mine. Therefore, I think that you should support Bostrom’s deal only if (a) you solely follow selfish motivations (which most people think is bad) or (b) you support my deal (and my deal seems horrible).
Why is Bostrom’s deal strictly worse than mine, if you have slight impersonal preferences? Under Bostrom’s deal, in 97% of cases everyone is dead. Under my deal the surviving 3% could have further generations who continue aspects of life we value, potentially flourishing for a long time.
One could disagree and propose ways my deal seems worse than Bostrom’s, but I think my deal can simply be modified to accommodate until my deal is better. For example, if you feel its more fair for everyone to face the same risk, suppose the 3% are selected by random sampling in my deal. If you favor Bostrom’s deal because it doesn’t split families and friends across living vs. killed, suppose the sampling in my deal is by large clusters of families and friends. If you favor Bostrom’s scenario because of non-lifespan ASI benefits, suppose an ASI confers those same benefits to the surviving 3% in my deal. Wherever you end up, my deal is still killing 97% of people to benefit 3%, so my deal is still horrible. Yet, Bostrom’s deal remains worse.
I am sympathetic that Bostrom set out reasonably to investigate ASI within a person-affecting framework. Unfortunately—and irrespective of Bostrom’s initial intentions—I think that his article has mainly turned out to be a list of justifications for the small, probably malevolent group of people who would accept a deal that kills 97% of humans to extend the lives of 3%.
Always read the footnotes!
The go/no-go model is not meant to show that a P(doom) of up to 97% is “acceptable” (or at least it would risk being highly misleading to say that). The model is only meant to show that up to that level of risk, launching superintelligence increases life expectancy under the given assumptions. That model ignores many important factors (such as distributional considerations and diminishing marginal utility in QALYs), which is why a series of more complicated models are introduced that take into account some of these other factors. (Even the most elaborate of the models introduced is still only very schematic and leaves out much that is relevant, as all formal models of this sort do. “For these and other reasons, the preceding analysis—although it highlights several relevant considerations and tradeoffs—does not on its own imply support for any particular policy prescriptions.”).
By the way, there may also be reasons to regard implementing a lottery that would involve going out and killing some random subset of the human population differently from allowing technological progress to continue—even if we were to stipulate that the two cases were exactly parallel with respect to some set of consequentialist outcome metrics. (Also, while in your example, using randomization would equalize people’s chances or ex ante expected lifespans, it would lead to radically uneven ex post outcomes. Some people with egalitarian intuitions care about inequality of outcomes, not only inequality of chances or opportunities—especially in cases where the inequality of outcomes is not connected to personal motivations, efforts, or choices.)
Thank you for your response!
I should have been clearer, yes. I meant that the 97% deals are acceptable to your go/no-go model, not to you or your later models.
However, I think my arguments apply equally to your later models, just with P(doom) different from 97%. (See below.)
Thank you for running the more complicated models. (And, in case unclear, I did read all your article before making any comments.)
Do the models help us understand how we should act? Here is how I look at it --
It’s difficult to get intuition about how good or bad the optimal ASI launch times are, because the envisioned situation is so far from experience.
In each model, there is a remaining P(doom) at the model-optimal launch time, call it R%. R% is sometimes large, sometimes small.
From a perspective that stays entirely within the specific person-affecting framework used by the models, the following deals have equal value
Deal 1: At ASI launch, all humans are killed with R% probability, but life expectancy becomes superhuman with probability 100% - R%.
Deal 2: At ASI launch, R% of humans are killed with certainty, which is the cost of providing superhuman life expectancy for the remaining 100% - R%.
What happens if we put one foot outside model assumptions and begin to care some about future generations? Are lessons of the models robust to a small step away from their assumptions?
If we care about future generations, this tiebreaks. Deal 1 seems worse than Deal 2, since under Deal 1 there may easily be no future generations, while under Deal 2 future generations can repopulate, have happiness, and so on. Even if one believes Deal 1 is not strictly worse than Deal 2, Deal 1 hardly seems much better.
Let’s now return to viewing things however we actually see them, without adopting a specific framework whose rules we restrict ourselves to follow. It’s difficult for me to get an intuitive grasp on Deal 1, but Deal 2 is easier to understand. There are a lots of similar historical precedents. Deal 2 is explicitly killing a large proportion of humans to let the others prosper more. It’s horrible.
We have seen that stepping even slightly outside the model’s person-affecting stance, Deal 1 is worse than Deal 2. Yet, Deal 2 is plainly awful. So what is the value of simulating optimal times for models to accept Deal 1? It is like modeling the ″best″ time to enact horror.
I should mention that the models often find high R% to be optimal. For example, with 50% initial P(doom) and 5%/yr safety progress, the model you used in Table 3 would launch when P(doom) remains 32% with overall life expectancy of 774 years, instead of waiting a handful of decades for P(doom) to fall to near 0. I noticed this when I coded your Appendix A model for the sensitivity analysis in my other comment (which also found a small error in your Table 3 -- see that comment for detail.)
I neglected this, thank you for raising it. I don’t think it undermines my argument, but let me know if you disagree.
Infinite regress issue?
I’m apologize if you addressed this somewhere or if I misunderstand, but is there an infinite regress issue with your models?
Take three times, T0, T1, and T2, each a year apart. Let average life expectancy be 40 years among the living at each time. Suppose the model is run at T0 and it says “Delay ASI launch 3 years”. However, if the model is run again at T1, it will still say “Delay ASI launch 3 years” because the model explicitly only cares about the living. And the same at T2 or later. So one would never reach the time to launch ASI.
I think this section is mostly just strawmen.
This might’ve been true of a Pause 2023 (in hindsight), but seems unlikely for a Pause in 2026.
These are all just saying that a Pause might be unsuccessful. We will have failed then (by not actually getting a Pause). This doesn’t mean that accelerating isn’t strictly worse in terms of risk.
This is just a non-sequitur. Our whole global economy is very far from being dependent on (proto-)AGI. How did we possibly manage to have economic prosperity without AI before?
Why is more advanced AI more likely to help than just cause more risk? This is just blind faith, when no one has the faintest idea how to solve superalignment or ASI control.
We don’t live under global totalitarianism because nuclear material, and chemical and biological weapons, (and hell, even conventional weapons in most countries,) are controlled. Right now controlling large data centers isn’t any more difficult than that.
This again, is a failed Pause. A successful Pause would prevent (and taboo) further compute and algorithm progress. And any real Pause would not be lifted until there is a consensus on safety.
We are already doing that now. Those systems will not going away with a Pause in further development.
Nick, you really aren’t helping with this paper.
This is already happening. The blame can’t be placed on the Pausers.
Any realistic global Pause is never going to be of a fixed, pre-determined length. It will be lifted when there is global consensus on lifting it (either through consensus on safety, or consensus on taking the risk).
I don’t have the qualifications to reason about the internal mathematics of the paper.
However, I think that discounting non-person-affecting preferences does a lot of the moral heavy lifting to this argument.
If I’m understanding correctly, the logic in the paper is for this generation to risk the future of the species and of the earth, just so that we in particular might not meet death. I think most people do have real non-person-affecting preferences.
Does excluding non-person affecting preferences imply that a society of ten happy ageless people is many orders of magnitude more morally desirable than a society of ten happy people, which sustained itself through the regular patterns of reproduction and death?
I am very happy this is now mainstream:
https://forum.effectivealtruism.org/posts/6j6qgNa3uGmzJEMoN/artificial-intelligence-as-exit-strategy-from-the-age-of
The risks that AGI implies for Humanity are serious, but they should not be assessed without considering that it is the most promising path out of the age of acute existential risk. Those who support a ban of this technology shall at least propose their own alternative exit strategy.
https://forum.effectivealtruism.org/posts/uHeeE5d96TKowTzjA/world-and-mind-in-artificial-intelligence-arguments-against
Bostrom is the absolute best.
Building ASI to reduce existential risk is only net-positive if the step risk associated with ASI is less than the state risk of the status quo for several decades which is doubtful.
You are right that we should include in our considerations ASI as a way out of the acute risk period.
When you do that, it doesn’t change the answer much. You still get the answer that we should be very very careful in how we build it. This is based on what we can now reasonably guess about alignment (based on the outside view that there are experts and difficult-to-evaluate but strong arguments for everything from 1% to 99%). It could very well be extremely risky. Which means from any reasonable epistemic view it’s effectively quite risky from our current perspective of ignorance.
Meanwhile the risk of nuclear annihilation (which wouldn’t end the species, just set it back a hundred or a thousand years) and other sources of disaster in the same category are perhaps 1% per year. But they have far less longterm consequence.
Even if you don’t care a whit for future generations (as Bostrom has assumed without clearly stating here), or you’re about to die and ALSO don’t care a whit for everyone currently alive who would live longer,
Factoring in how it would end the critical risk period, you STILL shouldn’t be rushing to AGI in the next few years.
Like we’re currently doing.