Sometimes I’m at my command prompt and I want to draw a graph.
Problem: I don’t know gnuplot. Also, there’s a couple things about it that bug me, and make me not enthusiastic about learning it.
One is that it seems not really designed for that purpose. It implements a whole language, and the way to use it for one-off commands is just to write a short script and put it in quotes.
The other is its whole paradigm. At some point in the distant past I discovered ggplot2, and since then I’ve been basically convinced that the “grammar of graphics” paradigm is the One True Way to do graphs, and everything else seems substandard. No offense, gnuplot, it’s just… you’re trying to be a graphing library, and I want you to be a graphing library that also adheres to my abstract philosophical notions of what a graphing library should be.
If you’re not familiar with the grammar of graphics, I’d summarize it as: you build up a graph out of individual components. If you want a scatter plot, you use the “draw points” component. If you want a line graph, you use the “draw line segments” component. If you want a line graph with the points emphasized, you use both of those components. Want to add a bar chart on top of that too? Easy, just add the “draw bars” component. Want a smoothed curve with confidence intervals? There’s a “smooth this data” component, and some clever (but customizable) system that feeds the output of that into the “draw a line graph” and “draw a ribbon” components. Here’s a gallery of things it can do
So, rather than adapt myself to the world, I’ve tried to adapt the world to myself.
There’s a python implementation of the paradigm, called plotnine.1 (It has its own gallery.) And now I’ve written a command-line interface to plotnine.
It’s not as powerful as it plausibly could be. But it’s pretty powerful2, and if I stop developing now I might find it fully satisfies my needs in future. For example, I took a dataset of covid cases-per-capita timeseries for multiple countries. Then both of these graphs came from the same input file, only manipulated by grep to restrict to twelve countries:
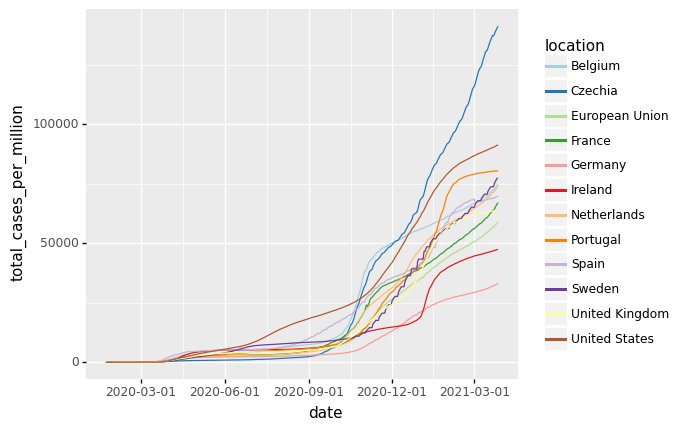
(The second one isn’t a type of graph that needs to be implemented specifically. It’s just a combination of the components “draw points”, “draw line segments” and “draw text”.)
Now admittedly, I had to use a pretty awful hack to get that second one to work, and it wouldn’t shock me if that hack stops working in future. On the other hand, I deliberately tried to see what I could do without manipulating the data itself. If I wasn’t doing that, I would have used a tool that I love named q, which lets you run sql commands on csv files, and then there’d be no need for the awful hack.
Anyway. If you’re interested, you can check it out on github. There’s documentation there, and examples, including the awful hack I had to use in the above graph. To set expectations: I don’t anticipate doing more work on this unprompted, in the near future. But if people are interested enough to engage, requesting features or contributing patches or whatever, I do anticipate engaging back. I don’t want to take on significant responsibility, and if this ever became a large active project I’d probably want to hand it over to someone else, but I don’t really see that happening.
-
I’m aware of two other things that could plausibly be called python implementations of the grammar of graphics, but on reflection I exclude them both.
The first is a package that used to literally be called ggplot. The creator of the original ggplot2 (if there was a prior non-2 ggplot, I can’t find it) pointed out that the name was confusing, so it got renamed to ggpy, and now it’s defunct anyway. But I don’t count it, because under the hood it didn’t have the grammar thing going on. It had the surface appearance of something a lot like ggplot2, but it didn’t have the same flexibility and power.
The other is one I started writing myself. I exclude it for being nowhere near complete; I abandoned it when I discovered that plotnine existed and was further along. I did think mine had the nicer API—I was trying to make it more pythonic, where plotnine was trying to be a more direct translation of ggplot2. But that hardly seemed to matter much, and if I really cared I could implement my API on top of plotnine.
I only remember two things plotnine was missing that I supported. One was the ability to map aesthetics simultaneously before and after the stat transform (ggplot2 only allows one or the other for each aesthetic). I’m not convinced that was actually helpful. Coincidentally, a few days ago plotnine 0.8.0 came out with the same feature, but more powerful because it supports after-scale too. The other was a rudimentary CLI, and now plotnine has one of those too. ↩
-
Most of this power, to be clear, comes from plotnine itself, from the grammar of graphics paradigm, and from python’s scientific computing ecosystem. My own contribution is currently less than 250 lines of python; I may have used some design sense not to excessively limit the power available, but I didn’t provide the power. ↩
Yes, I fully agree that using a grammar to represent graphics is the One True Way.
There’s a lab at UW that’s working to extend the same philosophy to support interactive graphics:
UW Interactive Data Lab | Papers (washington.edu). I haven’t had a chance to use it yet, but their examples seem pretty cool!
That’s awesome, thanks for the pointer! I’ve sometimes idly wondered if that would be possible.
Said this in a separate comment but wanted to add here that there is a python library wrapper for this which is pretty nice also: https://altair-viz.github.io/getting_started/overview.html
Altair is another somewhat more pythonic library based on the grammar of graphics. It’s also great for interactive visualizations.
https://altair-viz.github.io/getting_started/overview.html
Thank you. I’m unlikely to generate charts by CLI but always interested in “grammars of graphics”. And you seem to have found a good adaptation to the *nix CLI for charts.
Thank you also for the links esp. to Q (https://github.com/harelba/q) which I have already installed because I will absolutely use it.
For plotting, I usually use pythons matplotlib.pyplot
https://matplotlib.org/stable/gallery/index.html
This roughly corresponds to the grammer of graphics approach described. There is one function that can do line or point plots. Another to do bar plots. Another to do heatmap plots. Another to do stream plots. Ect. You can call these functions multiple times and in combination on the same axis to say add points and a heatmap to plots. You can get multiple subplots and control each independently. It doesn’t have builtin data smoothing, if you want to smooth your data, you have to use numpy or scipy interpolation or convolution functions. (There are actually quite a few interpolation and smoothing operations you might meaningfully want to do to data.)
Yeah, matplotlib is what plotnine is built upon (and so was my own attempt).
I wouldn’t say it has the grammar of graphics, though it’s likely I described that badly. (I thought about whether my description was accurate; in hindsight, I didn’t much think about whether it was precise.)
For example, compare its stacked and grouped barcharts. To swap between the two you need to recalculate the position of each rectangle. Imagine adding a third group; for the stacked you need a new call to
ax.barwithbottom=men_means + women_means, and for the grouped you need a third call plus you need to change the x positions in the existing calls. Now imagine you don’t know a priori how many groups there are.In ggplot2, you just choose between
position="dodge"andposition="stack". (I think “stack” is the default if you don’t specify. Or there’s “fill” to normalize the bar heights.) Similarly, looking at altair, its stacked and grouped examples are very similar to each other, though I don’t really know what’s going on with the grouped.To clarify, there’s no reason the smoothing needs to be limited to a single operation, and it isn’t in ggplot2 or plotnine. Both let you choose between some builtin methods or use a custom one.
I think I see the distinction you are trying to make. But I see it more as a tradeoff curve, with either end being slightly ridiculous. On one extreme, you have a program with a single primitive, the pixel, and the user has to set all the pixels themselves. This is a simple program, in that it passes all the complexity off to the user.
The other extreme is to have a plotting library that contains gazillions of functions and features for every type of plot that could ever exist. You then have to find the right function for Quasi rectiliniar radial spiral helix fourier plot.
Any attempt that goes too far down the latter path will at best end up as a large pile of special case functions that handle most of the common cases, and the graphics primitives if you want to make an unusual plot type.
Sure, most of the time your using a bar chart you’ll want dodge or stack, but every now and again you might want to balance several small bars on top of one big one, or to do something else unusual with the bars. I agree that in this particular case, the tradeoff could be made in the other direction. But notice the tradeoff is about making the graphics package bigger and more complex. Something people with limited devop resources trying to make a package will avoid.
At some point you have to say, if the programmer wants that kind of plot, they better make it themselves out of primitives.
Substance: is grammar of graphics actually a good paradigm? It’s a good question, and I’m not convinced my “it’s the One True Way” feeling comes from a place of “yes I have good reason to think this is a good paradigm”. I haven’t actually thought much about it prior to this, so the rest of my comment is kind of tentative.
So let’s say for now we don’t need any form of interactivity, it’s fine to just think of a plot as being a list of pixels. I’m not sure we do have the tradeoff you describe? Certainly it’s not a one-dimensional one. You could imagine a program that forces you to just set every pixel, and then you could imagine that it adds functions for “draw a line”, “draw a filled-in rectangle”, but you still have access to the raw pixels. And then it can add “draw a bar chart” and “draw a line graph”, and so on, all the way up to “draw a quasi rectiliniar radial spiral helix fourier plot”, and it never needs to lose access to “draw a raw pixel”.
The awkward thing is, once you have “draw a bar chart” etc., the programmer doesn’t necessarily know which pixels will get set, and at that point “draw a pixel” becomes a lot less useful. But that’s kind of true with the lower-level primitives too, as soon as you start calling them based on runtime data. Is there space in one corner to place the legend? That’s not necessarily easier to figure out when you’re just drawing pixels than when you’re calling a high-level “draw graph” function.
(Though it might be less differential effort. Like, if you’re already looping through your data manually, you can add a flag for any points in the corner. If you’re just passing your data to another function that loops through it, you now need to add a manual loop. And if you don’t know exactly where that other function draws, based on the data, maybe you don’t know when to set that flag… but the worst case scenario is that function doesn’t make your life easier, and then you can just not use it.)
Where I’m going at with this: okay, suppose you’re using plotnine and it doesn’t implement the kind of plot you want. Is it any harder to implement that plot in plotnine than it would be in matplotlib? I’m not sure it is. If you want to balance several small bars on top of a big one, in matplotlib you need to figure out the x,y,w,h (or equivalent) of a bunch of rectangles. In plotnine, if you have the x,y,w,h of a bunch of rectangles, you can just draw them. It’s maybe a little more friction, for example you might be less familiar with the “draw an arbitrary rectangle” component than the “draw a rectangle given just x,h” component that figures out y,w for you (and is probably implemented in terms of the previous). But, I guess it feels like relatively low friction compared to the hassle of figuring out the coordinates.
So that’s part of my answer. You say there’s a tradeoff to be made, but I’m not sure a grammar of graphics is taking significant losses on that tradeoff.
And on the other hand, is it making significant gains?
A naive answer: each layer in ggplot or plotnine has a “geom”, a “stat” and a “position”. You can mix-and-match these, so O(l+m+n) effort gives you O(lmn) types of graph.
This is obviously silly. Some of the elements aren’t compatible with each other, and some of those types of graph you’d never want. But do you get some gains in that direction? It seems to me that you do; the same position adjustment (“dodge”) that puts your bars in a bar chart side-by-side will probably put your boxplots side-by-side too. On the other hand it might not be loads—it looks like most stats are implemented for specific geoms, for example. There’s only one geom that uses stat_boxplot by default, and only one that uses stat_ydensity, and stat_smooth. You could use stat_boxplot with a geom other than geom_boxplot, but I don’t know if you ever would. I guess one thing you do get from this setup is, with a clear distinction between the statistical transformation and the data-drawing, you’re unlikely to ever say “aw man, this boxplot-drawing function expects me to pass in my raw data to compute the statistics itself, but I already have the statistics and I threw out the raw data”. That’s fine, you just use geom_boxplot with stat_identity.
So, I guess my sense is that a grammar of graphics does help make things easier, relative to lower-level things. Like, makes more types of things easy, with less effort (and less forethought) needed from the people making the existing things.
But I’m not super confident about either of these, and this is almost entirely theoretical, so.
Aside: this seems to be exploring the question “is the grammar of graphics a good paradigm”, which is different from the previous question “does matplotlib use the grammar of graphics paradigm”. Which is fine, it’s a good question to explore, just, yeah, different.
Another aside: I think it’s worth mentioning that the “everything is pixels” end of the spectrum would also need a way for data to flow back up to the program, or it wouldn’t be as functional as matplotlib, let alone something truly interactive like d3 or vega-lite (the interactive one mentioned above). Like, matplotlib doesn’t just draw a set of pixels to a canvas and then the interactive viewer scales/crops/zooms the canvas. When you resize the interactive viewer, two pieces of text might go from overlapping to non-overlapping or vice-versa.
Another way to say this, you can’t just think of a matplotlib plot as being ultimately a list of pixels which something else will draw; a matplotlib plot is a function from canvas parameters to a list of pixels. (And maybe other inputs I forget. And this is also true of plotnine, being implemented on top of matplotlib.)
I guess I want to say this because… yes, in the end everything on the screen is pixels, but if you were to think “everything is pixels so I’ll just draw pixels” there’s a good chance you’d be missing something. Similar: everything on a standard monitor is ultimately pixels (except not really) and vector graphics have to be rendered to pixels, but vector graphics are still in some sense fundamentally more powerful than raster graphics, even though raster graphics can draw any combination of pixels.
I’ll try to respond to the substance in another comment later.