TL;DR: No.
What Do I Mean By ‘Overhang’?
Hardware Overhang for AI
One major concern about pausing AI development, from a purely safety perspective, is the possibility of hardware overhang.[1] Here is the concern as I understand it:
Suppose a policy were put in place tomorrow that banned all progress in AI capabilities anywhere in the world for the next five years.[2] Afterwards, the ban would be completely lifted.
Hardware would continue to progress during this AI pause. Immediately after the pause ended, it would be possible to train new AI systems using significantly more compute than was previously possible, taking advantage of the improved hardware. There would be a period of extremely rapid growth, or perhaps a discontinuity,[3] until the capabilities returned to their previous trend. Figure 1 shows a sketch of what we might expect progress to look like.

Figure 1: What AI progress might look like if there were a temporary pause in capabilities progress. The ‘overhang’ is the difference between what AI capabilities currently are as a result of the pause and what AI capabilities could be if the pause had never been enacted, or were completely lifted.
It might be worse for safety to have a pause followed by extremely rapid growth in capabilities than to have steady growth in capabilities over the entire time frame. AI safety researchers would have less time to work with cutting edge models. During the pause, society would have less time to become accustomed to a given level of capabilities before new capabilities appeared, and society might continue to lag behind for some time afterwards.
If we knew that there would be catch-up growth after a pause, it might be better to not pause AI capabilities research now and instead hope that AI remains compute constrained so progress is as smooth as possible.
We do not know if there would be extremely rapid growth after a pause. To better understand how likely hardware overhang would be, I tried to find examples of hardware-overhang-like-things for other technologies.
Overhang for Other Technologies
Many technologies have an extremely important input—like GPUs/TPUs for AI, or engines for vehicles, or steel for large structures. Progress for these technologies can either come from improvements in the design of the technology itself or it can come from progress in the input which makes it easier to improve the technology. For AI, this is the distinction between algorithmic progress and hardware progress.
I am being purposefully vague about what ‘progress’ and ‘input’ mean here. Progress could be in terms of average cost, quantity produced, or some metric specific to that technology. The input is often something very particular to that technology, although I would also consider the general industrial capacity of society as an input. The definition is flexible to include as many hardware-overhang-like-things as possible.
It is possible for there to be a pause in progress for the technology itself, perhaps due to regulation or war, without there being a pause in progress for the inputs. The pause should be exogenous: it is a less interesting analogy for AI policy if further progress became more difficult for technical reasons particular to that technology.[4] It is possible for AI progress to pause because of technical details about how hard it is to improve capabilities, and then for a new paradigm to see rapid growth, but this is a different concern than overhang due to AI policy. Exogenous pauses are cases where we might expect overhang to develop.
Examples of Overhang
Methods
To find examples of overhang, I looked in the data for our Discontinuous Progress Investigation[5] and in the Performance Curve Database.[6] The Performance Curve Database contains 135 entries, most of which include both average cost and production quantity as a function of time. The Discontinuous Progress Investigation contains 21 case studies. The specific metric or metrics for each case study is different, but should be a proxy for how ‘good’ a particular technology is and should have sufficient historical data to establish a trend. Most of these only include record performance on this metric. In total, I looked at several hundred graphs of some notion of progress for a technology.
I initially looked for data which had a similar shape to Figure 1: a clear trendline showing growth, followed by a pause, followed by rapid growth and a return to the previous trendline. If I found this pattern, I would then try to figure out the cause of the pause and the subsequent growth. If the pause was caused by an external factor, and the subsequent growth was driven by having better inputs, then this would be an example of overhang.
I also thought of technologies which were banned, and for which the ban was later completely reversed, to check whether they follow the pattern predicted by overhang.
The Closest Example I Found: Land Speed Records
Figure 2 shows the fastest any vehicle traveled on land over a distance of either 1 km or 1 mi from 1900 to 2000, according to Wikipedia.

Figure 2: Historic land speed records in mph over time. Speeds on the left are an average of the record set in mph over 1 km and over 1 mile. The red dot represents the first record in a cluster that was from a jet propelled vehicle.[7] The trendline shown is fit to the data from 1920-1940 and extrapolated.
This data shows several pauses. The most interesting one for this blog post is from 1939 to 1963. The first pause had similar growth before and after the pause, with no catch-up growth, and the last pause has less data to establish a clear trendline after the pause.
In 1939, progress in the land speed record abruptly stopped. No new records were set until 1947, and significant progress on this metric did not resume until 1963. Then there was extremely rapid progress over the next two years. This looks like catch-up growth, although it did not quite reach the previous trendline. It also was not sustained, and the catch-up growth was followed by another pause.
The explanation for this pattern follows what we would expect for overhang. The important input is the engine: having a more powerful engine is extremely important for making a car go fast. The exogenous source of the pause was WWII, which caused industrial capacity to shift towards more strategically important technologies. During WWII, engine progress continued. In particular, jet engines were developed for aircraft. Jet engines were initially reserved for military aircraft, and were not widely available for private buyers until after 1958, when the Boeing 707 entered service. In 1963, the land speed record was broken by a car with a jet engine for the first time, which began a period of rapid progress.
One other consideration for the land speed record is that it is not strategically or economically important, especially after WWII, so relatively small amounts of resources have been devoted to it. The most expensive record-breaking land vehicles cost millions or tens of millions of dollars.[8] If this were a more important technology, someone might have built a car with a jet engine earlier, leading to more continuous growth.
This is the only example I found which had an exogenous pause, and then faster growth after the pause.
Endogenous Pauses: Optical Cables and Particle Accelerators
The data I found that looks most like Figure 1 involves optical cables, and is shown in Figure 3. There is a clear trend, followed by a pause, followed by rapid growth that catches up to the previous trendline. The trend continues for another decade beyond the edge of this graph, through generations 5 & 6.

Figure 3: Bandwidth-distance product in fiber optics alone,[9] from Agrawal, 2016.[10]
This figure comes from a book chapter (Agrawal, 2016) which also explains the history. The cause of the pause was endogenous: it was determined by technical details of the technology itself, rather than something external. The original trendline is actually a combination of S-curves, each of which corresponds to a significant change in the design of the cables, called a ‘generation’ of the technology. The transition between most generations required a single significant change. The transition between generations 3 & 4 required three simultaneous changes to work. This explains why the transition occurred later, and resulted in more rapid growth, than the other transitions.
Particle accelerators have followed a similar pattern as optical cables, as shown in Figure 4. There are periods of slower growth, followed by periods of rapid growth. The slower growth was caused by diminishing returns to existing designs, and the faster growth was caused by new accelerator designs.[11] The result is again a combination of S-curves. This pattern can be entirely explained by factors internal to the technology, rather than anything exogenous.
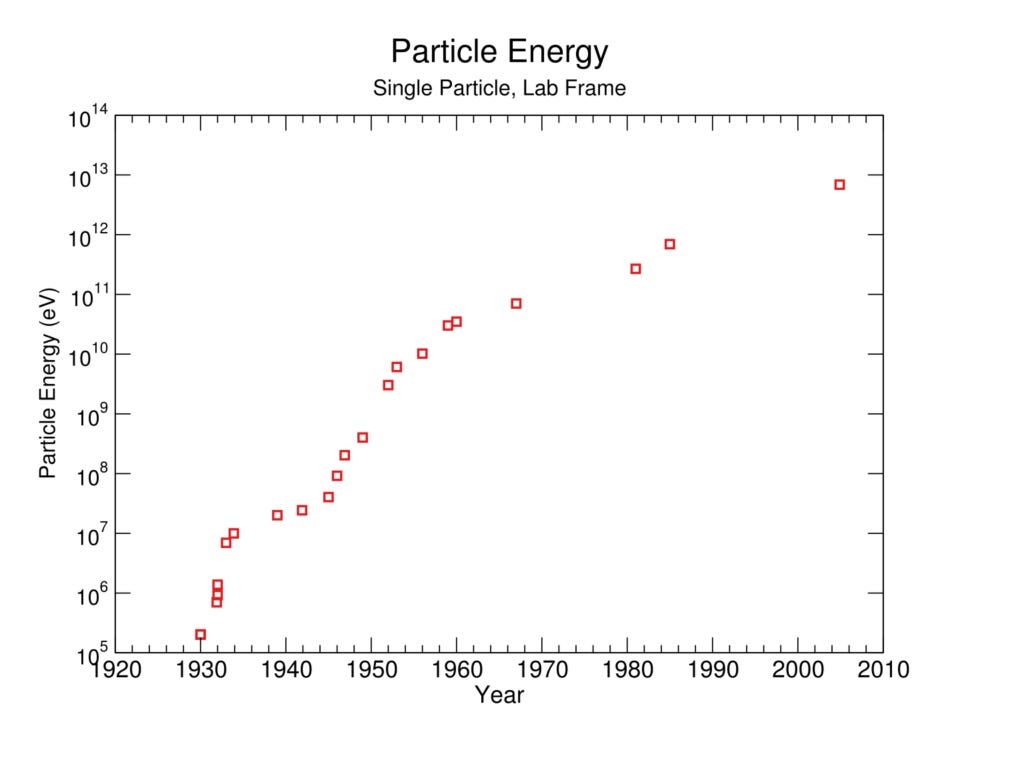
Figure 4: Record center of mass energy for a particle-particle collision in a particle accelerator from 1920 to 2010. Note the three distinct S-curves from about 1930-1945, 1945-1970, and 1970-2010.[12]
While this is an interesting way that a technology can develop, it is not a precedent for hardware overhang developing as a result of AI policy.
Prohibition of Alcohol
One example of a technology which was banned, and for which the ban was then completely reversed, is the Prohibition of alcohol in the US from 1920-1933.
The real cost of producing alcohol has fallen over time, as expected for a manufactured good.[13] During Prohibition, general industrial practices in the US improved substantially, and alcohol continued to be produced at scale in other countries, likely resulting in continued progress there. This seems like a situation where overhang might develop.
Unfortunately, I have not been able to find data on the cost of producing alcoholic beverages[14] before and after Prohibition. The way economic data are reported changed significantly during the early 1900s, so it is difficult to compare data before[15] to data after.[16] There are data and proxies for the consumption of alcohol before, during, and after Prohibition, shown in Figure 5, which show lower consumption after Prohibition than before. This does not suggest a significant reduction in the cost of alcohol immediately after Prohibition ended.

Figure 5: Alcohol consumption before and after Prohibition (squares, thicker line) and several proxies for alcohol consumption during Prohibition. Plot from Miron & Zwiebel, 1991.[17]
Other Examples?
These are the best examples of overhang I have been able to find. None of them match the behavior that people seem to expect will happen with hardware overhang.
Most of the data series seem even less like overhang than these. Many do not have clear trendlines, which makes them hard to interpret. Many have pauses followed by similar or slower growth. When there is a discontinuity in technological progress (which is uncommon, but exists), it is more likely to be preceded by accelerating growth than by a pause.
If you are aware of any technology where you think overhang might have occurred, please let me know in the comments below.
Why Are There No Good Examples Of Overhang?
This section is more speculative than the previous section.
The lack of examples of overhang for other technologies makes me skeptical that this would happen for AI. Catch-up growth for a particular technology after a pause is at least uncommon.
Here are some possible explanations I have considered for the observed lack of overhang. Feel free to suggest more in the comments.
There’s Nothing So Permanent as a Temporary Government Program
One premise of overhang is that a ban on progress for a particular technology would be enacted for a certain amount of time, and then completely ended. This is not how regulations normally work.[18]
There are lots of things which are regulated, many of which require complicated standards or enforcement mechanisms.[19] It is easier to enact a regulation than it is to repeal a regulation. This is known as the ‘regulatory ratchet.’[20] Legislatures and regulatory agencies have a mandate to pass new laws or regulations in response to problems. While they also have the power to repeal regulation, there is typically less incentive for them to work on repeals. Sunset laws might make this more symmetric, but they are uncommon.
Even if a ban is initially temporary, it is likely to be extended. The political coalition which was successful at getting the temporary ban enacted will still exist as the ban nears its end date. They were powerful enough to win before, and now they have status quo bias on their side. The industry which opposes the ban likely has less money and influence as a result of the ban. We should expect most new regulation to be permanent, unless its consequences are so visibly bad[21] that it empowers a reaction much stronger than the initial movement. Even when a political party makes repealing a particular piece of legislation a central plank of their platform, and then wins major electoral victories, it is still hard to get the legislation repealed.[22]
When a ban is reversed, it is unlikely to be fully reversed. Bans which are temporary are sometimes enacted to give the relevant community time to figure out what good policies are. The ban ends when these policies are enacted, but the new policies often maintain some restrictions from the previous ban. The Asilomar Conference on Recombinant DNA follows this pattern. In 1974, the National Academy of Sciences (NAS) enacted a temporary ban[23] on all experiments involving recombinant DNA, in response to concerns about biohazardous experiments. The Asilomar Conference in 1975 prohibited certain kinds of experiments, and provided recommendations for other experiments. After Asilomar, the total ban was reversed, and replaced with these strict guidelines.[24] Some of these guidelines have since been scaled back, but regulation on recombinant DNA remains stricter than it was before the temporary ban.
Dispelling the Hype
Emerging technologies depend on hype. They are often not currently profitable, so they rely on promises of future success to acquire the resources they need. Without the hype, startups would fail and established companies would shift their investments elsewhere.[25]
Increasing regulations or bans are effective ways to dispel hype, even if they are enacted temporarily. People would (reasonably) expect that they might not be temporary. The ban is a strong signal to the private sector and foreign countries that this technology is not going to be the next big thing and reduces their expected value for pursuing it. The hype seems unlikely to fully return after a ban is lifted.
There are two main resources driven by hype: venture capital and talent.
Venture capital is the most obvious resource fueled by hype. Investors know that startups are promising more than they can currently deliver, but believe that there is a good enough chance that they will be able to deliver in the future that they are worth investing in. If something happens that makes investors think that startups in a field will systematically not be able to deliver, that available capital can quickly shift elsewhere.
Talent responds more slowly than capital. If there is a ban that is expected to last more than a few years, then students who are choosing their careers are less likely to want to go into that field, and people who currently work in the field are more likely to consider switching careers. While venture capital might quickly return after a ban is lifted, re-recruiting talent that has gone elsewhere would take longer.
Reduced Demand for the Input
Overhang assumes that progress for the input will continue to develop during the pause, the same as if the pause did not occur.
It is not obvious if this would be the case for AI. AI is one of the major markets for GPUs and is the sole market for TPUs. We should expect counterfactually less progress in GPUs & TPUs as a result of AI regulation.
It might be different if the technology which was paused accounts for a small fraction of the total market of the input. Extremely fast cars account for effectively none of the market for jet engines.
For technologies which account for a larger fraction of the demand for their inputs, progress in their inputs is less likely to continue at the same rate if they are paused. They would have less catch-up growth immediately available afterwards.
Conclusion
I do not think that technologies typically develop overhang if they are subject to an exogenous pause. I know of no good examples of overhang from other technologies.
There are several plausible reasons why overhang is uncommon. Most regulations are not temporary, most ‘temporary’ regulations or bans are extended, and when bans are ended, this is often accompanied by stricter regulation than there was before. Temporary bans can dispel the hype surrounding an emerging technology causing venture capital and (more slowly) talent to leave the field. The assumption that progress in the input continues the same as before if one of its major customers gets paused also seems suspect.
As an example of how people do not expect overhang elsewhere, consider nuclear power. Nuclear power was getting steadily cheaper in the 1960s. Then, increasing safety regulation applied to nuclear power caused the learning curve to reverse, and the cost of building new nuclear reactors increased dramatically.[26] Nuclear power advocates argue that, if we reduced regulations on nuclear power to a more reasonable level, we could see prices drop by a factor of 10 to return to the construction costs of the 1960s. Nuclear power advocates do not extrapolate the trendline from the 1960s to today and predict that, if this regulation were repealed, nuclear power would suddenly become 106 times cheaper than it is today, which is what we would expect if the overhang model applied. Extrapolating all the way to today is probably unreasonable: there’s a good chance that nuclear power would not have followed the trendline for that long anyway.[27] Nuclear power advocates’ optimistic views are less optimistic than what they would expect if they predicted even partial overhang.

Figure 6: Trendline for nuclear power plant construction costs in the US. Data are from Lovering et al.[28] and digitized using WebPlotDigitizer.[29] The trendline is fit to data from 1963-1966 and extrapolated to the year 2000. Extrapolating to 2023 results in two orders of magnitude of further cost reduction.
I think that hardware overhang can still be worth considering as something bad and plausible, but we should not treat overhang as the default or most likely future if there is a temporary pause in AI development. It seems more likely that AI progress would resume at a similar or slower rate after the ban is lifted, if it is lifted at all.
Thanks to Rick Korzekwa, Harlan Stewart, Zach Stein-Perlman, Rocket Drew, McKenna Fitzgerald, Ryan Kidd, Curt Tigges, and Alex Gray for helpful discussions on this topic.
- ^
Zach Stein-Perlman. Cruxes for overhang. AI Impacts Blog. (2023) https://blog.aiimpacts.org/p/cruxes-for-overhang.
- ^
This blog post does not consider how this would be implemented. The focus is on what the effects would be if it were.
- ^
I am using ‘discontinuity’ in the sense of our discontinuous progress investigation:
Discontinuous progress investigation. AI Impacts Wiki. (Accessed December 5, 2023.) https://wiki.aiimpacts.org/ai_timelines/discontinuous_progress_investigation.
- ^
This is not that uncommon. There are examples of progress for a particular technology stopping:
Examples of Progress for a Particular Technology Stopping. AI Impacts Wiki. (Accessed December 5, 2023.) https://wiki.aiimpacts.org/ai_timelines/examples_of_progress_for_a_particular_technology_stopping.
- ^
Discontinuous progress investigation. AI Impacts Wiki. (Accessed December 5, 2023.) https://wiki.aiimpacts.org/ai_timelines/discontinuous_progress_investigation.
- ^
Performance Curve Database. Santa Fe Institute. (Accessed December 6, 2023.) https://pcdb.santafe.edu.
- ^
Historic trends in land speed records. AI Impacts Wiki. (Accessed December 5, 2023.) https://wiki.aiimpacts.org/doku.php?id=takeoff_speed:continuity_of_progress:historic_trends_in_land_speed_records.
- ^
Dominik Wilde. Bloodhound Land Speed Record Project Enters Administration. Motor1 (2018) https://www.motor1.com/news/270039/bloodhound-land-speed-administration/.
- ^
Historic trends in telecommunications performance. AI Impacts Wiki. (Accessed December 5, 2023.) https://wiki.aiimpacts.org/takeoff_speed/continuity_of_progress/historic_trends_in_telecommunications_performance?s[]=fiber&s[]=optics#easy-footnote-bottom-12-1368.
- ^
Govind P. Agrawal. Optics in Our Time. Ch. 8: Optical Communication: Its History and Recent Progress. Figure 8.8. (2016) p. 177-199. https://link.springer.com/chapter/10.1007/978-3-319-31903-2_8.
- ^
Short History of Particle Accelerators. CERN. (2006) p. 45. https://cas.web.cern.ch/sites/default/files/lectures/zakopane-2006/tazzari-history.pdf.
- ^
Historic trends in particle accelerator performance. AI Impacts Wiki. (Accessed December 5, 2023.) https://wiki.aiimpacts.org/takeoff_speed/continuity_of_progress/historic_trends_in_particle_accelerator_performance.
- ^
The cost of alcohol at home has increased by 44% from 2000-2023, compared to a 79% increase in costs overall.
Stefan Skyes. Here’s how the price of your beer has changed over time. CNBC. (2023) https://www.cnbc.com/2023/06/02/here-is-why-beer-prices-are-going-up-according-to-our-data.html.
- ^
I have found several data series on ethyl alcohol covering this time frame, but this was not banned:
FRED. Price of Ethyl Alcohol, Grain for New York. St. Louis Fed. (Accessed December 5, 2023.) https://fred.stlouisfed.org/series/M04177US000NYM054NNBR.
FRED. Ethyl Alcohol Production for United States. St. Louis Fed. (Accessed December 5, 2023.) https://fred.stlouisfed.org/series/M01226USM441NNBR.
FRED. Ethyl Alcohol Stocks, at Warehouses for United States. St. Louis Fed. (Accessed December 5, 2023.) https://fred.stlouisfed.org/series/M05043USM441NNBR.
- ^
Data before Prohibition tend to involve prices for particular goods, found by having government officials ask wholesale suppliers what they pay to purchase them. See, for example:
Carroll D. Wright. Comparative wages, prices, and cost of living. Sixteenth annual report of the Massachusetts Bureau of Statistics of Labor. (1885) p. 126-129. https://babel.hathitrust.org/cgi/pt?id=hvd.32044050806330&seq=141.
Carroll D. Wright. Bulletin of the Department of Labor 27. (1900) p. 260. https://fraser.stlouisfed.org/files/docs/publications/bls/bls_v05_0027_1900.pdf?utm_source=direct_download.
Wholesale Prices 1890 to 1913. Bulletin of the United States Bureau of Labor Statistics 149. (1914) p. 164. https://fraser.stlouisfed.org/title/wholesale-prices-160/wholesale-prices-1890-1913-497569.
- ^
Data after Prohibition tend to involve total personal expenditures on alcohol or total alcohol produced by the country as a whole. See, for example:
FRED. Personal consumption expenditures: Nondurable goods: Alcoholic beverages purchased for off-premises consumption. St. Louis Fed. (Accessed December 6, 2023.) https://fred.stlouisfed.org/series/DAOPRC1A027NBEA.
FRED. Personal consumption expenditures: Nondurable goods: Alcoholic beverages purchased for off-premises consumption (chain-type price index). St. Louis Fed. (Accessed December 6, 2023.) https://fred.stlouisfed.org/series/DAOPRG3A086NBEA.
FRED. Personal consumption expenditures: Nondurable goods: Alcoholic beverages purchased for off-premises consumption (chain-type quantity index). St. Louis Fed. (Accessed December 6, 2023.) https://fred.stlouisfed.org/series/DAOPRA3A086NBEA.
- ^
Jeffrey A. Miron and Jeffrey Zwiebel. Alcohol Consumption During Prohibition. NBER Working Papers Series 3675. (1991) https://www.nber.org/papers/w3675.
- ^
A recent preprint looked at the persistence of policies decided by small margins in state referendums. It found that the likelihood that a policy remains in effect initially declines from 100% to about 40% over a few decades, then plateaus. Even a century later, 40% of the closely decided referenda remained in force, in some cases despite becoming less popular with the general public.
Zach Freitas-Groff. Persistence in Policy: Evidence from Close Votes. (2023) https://zachfreitasgroff.b-cdn.net/FreitasGroff_Policy_Persistence.pdf.
- ^
Examples of Regulated Things. AI Impacts Wiki. (Accessed December 11, 2023). https://wiki.aiimpacts.org/responses_to_ai/examples_of_regulated_things.
- ^
Mark R. Lee. The Regulatory Ratchet: Why Regulation Begets Regulation. University of Cincinnati Law Review 87.3. (2019) https://scholarship.law.uc.edu/cgi/viewcontent.cgi?article=1286&context=uclr.
- ^
Note that regulation does not just have to be bad: it has to be very visibly bad. Very impactful legislation does not have to be visible, if it is felt through slower than counterfactual economic growth, for example.
- ^
Examples include Democrats’ opposition to the Bush tax cuts and Republicans’ opposition to Obamacare. The Bush tax cuts were set to expire after 10 years, but in 2013 they were made permanent for individuals making less than $400,000 per year. Republicans ran opposing Obamacare for years, but once they were in full control of the government, they were unable to repeal it. The biggest change they were able to make was setting the penalty of the individual mandate to zero in 2019. Lower profile legislation is even less likely to be repealed.
- ^
The NAS is a nonprofit organization, which does not have the power to enforce its policies. It was influential enough that their ban was followed, and it often advises regulatory agencies’ policy decisions.
- ^
Paul Berg. Asilomar 1975: DNA modification secured. Nature 455. (2008) p. 290-291. https://www.nature.com/articles/455290a.
While the NAS does not enforce the guidelines itself, the NIH requires them in order to receive funding.
- ^
My not particularly well informed model of the dot com bubble and crash is that it was primarily driven by hype. The internet was the next big thing, so resources poured into it—more so than could be productively used. Once people realized that this was a bubble, the hype dissipated and the market crashed. This is an example of hype being dispelled private, while this blog post discusses government action which dispels the hype.
- ^
Jason Crawford. Why Nuclear Power Has Been A Flop. Roots of Progress. (2021) https://rootsofprogress.org/devanney-on-the-nuclear-flop.
- ^
Examples of Progress for a Particular Technology Stopping. AI Impacts Wiki. (Accessed December 5, 2023.) https://wiki.aiimpacts.org/ai_timelines/examples_of_progress_for_a_particular_technology_stopping.
- ^
Lovering, Yip, & Nordhaus. Historical construction costs of global nuclear power reactors. Figure 2. Energy Policy 91. (2016) p. 371-382. https://www.sciencedirect.com/science/article/pii/S0301421516300106.
- ^
Ankit Rohatgi. WebPlotDigitizer 4.6. (Accessed December 4, 2023) https://apps.automeris.io/wpd/.
Historically have you found an example of a worldwide pause for a strategically relevant technology? Something negotiated by agreement that wasn’t immediately defected on?
Skimming https://en.wikipedia.org/wiki/Arms_control I see a couple interesting tidbits: the Washington Naval Conference did result in “an effective end to building new battleship fleets, and the few ships that were built were limited in size and armament”. This seems to fit your reference class!
And then after the Treaty ended in 1936 (with defections throughout), we get:
BB is battleship, there’s only 10 new ones, but 141! aircraft carriers. In tonnage this would fit the reference class of “after the pause, more ships than ever”. Also, the USN had discovered the carrier hard countered all other surface combatants. The AI equivalent might be post pause few new GPUs are built, it’s all neural accelerator ASICs.
Another view, close to 10x the scale in 4 years. This looks like a fit for your reference class.
It’s a tight fit another way. What you would expect in a timeline where all the world powers do agree to some kind of AI limitations. During that time period, similar to the post washington navy treaty, you might get an equivalent to:
The United States developed better technology to get better performance from their ships while still working within the weight limits, the United Kingdom exploited a loop-hole in the terms, the Italians misrepresented the weight of their vessels, and when up against the limits, Japan left the treaty.
You can imagine this happening many ways for AI, where each party to the pause finds a different route to evade it.
Eventually what would happen is breakout, where one of the superpowers reaches the capability level for exponential growth or achieves some other advantage that threatens the others. The other parties to the pause must unpause or die, and you would see something like the above. Looks like humans could double their warships in existence 3 times in ~4 years, presumably robots constructing robots and weapons will be faster.
I have now looked into this example, and talked to Bean at Naval Gazing about it.
I found data for the total tonnage in many countries’ navies from 1865-2011. It seems to show overhang for the US navy during the interwar years, and maybe also for the Italian navy, but not for any of the other great powers.
Bean has convinced me that this data is not to be trusted. It does not distinguish between warships and auxiliary ships, or between ships in active duty and in reserve. It has some straightforward errors in the year the last battleship was decommissioned and the first nuclear submarine was commissioned. It seems to be off by a factor of 10 at some points. There seems to not be a dataset covering this time period that is even accurate to within a factor of 2 for me to do this analysis with.
Even if the data were reliable, it’s not clear how relevant they would be. It seems as though the total tonnage in the navy of an industrialized country is mostly determined by the international situation, rather than anything about the technology itself. If the trend is going up, that mostly means that the country is spending a larger fraction of its GDP on the navy.
I don’t think that this changes the conclusions of the post much. Overhang is uncommon. It happened partially for land speed records, but it was not sustained and this is not a technology that people put much effort into. Something that looks sort of similar might have happened with the US navy during the interwar period, but not for the navies of any of the other great powers, and the underlying dynamics seem to be different.
What are we trying to model here or find examples of?
Here’s what I think we’re trying to model: if a technology were isolated and for whatever reason, development was stopped, then during the ‘stopped’ period very little effort is being put into it.
After the ‘stopped’ period ends, development resumes and presumably progress is proportional to effort, with an unavoidable serial part of the process (from Amdahl’s law/ Gant charts show this) restricting the rate that progress could be made at.
For US Navy tonnage : without a washington Naval treaty, and a Great Depression and a policy of isolation, the US Navy would presumably have built warships at a steady rate. They did not, as shown in your data.
However, during this prewar period, other processes continued. Multiple countries continuously improved aircraft designs, with better aerodynamics (biplane to mono), carrier launching and landing, ever larger and more powerful engines, dive and torpedo bombing, and other innovations.
So even though very few ships are being built, aircraft are being improved. Now Pearl harbor, and unpause. All out effort, which shows in the data you linked.
But we don’t have to trust it, all that really matters is the aircraft carrier numbers, nothing else. As it turned out, the carrier was a hard counter to everything, even other carriers—the other ships in a carrier battle group are there to hunt submarines, supplement the carriers antiaircraft fire, and resupply the carriers. While there were direct gun battles in late ww2 in the Pacific theater, better admirals could probably have avoided every battle and just sank all the enemy ships with aircraft. Shooting down enemy aircraft was also way easier, it turned out, to do with aircraft.
So only the left column matters for the model, and you also need the 0 point. There were seven fleet aircraft carriers and one escort carrier at t=0, beginning of ww2.
If we count the escort carriers at 30% of a fleet carrier, and there were 27 new fleet carriers, then the total of “weighted” carriers went from 7.3 (prewar) to 61.2 (weighted, 1945).
8.38x increase in the most relevant parameter.
The data you don’t trust, 1940 tonnage is 1956867 and 1945 tonnage is 11267550. Increase of 5.75x.
In terms of “relevant” tonnage obviously aircraft carriers, due to their role as a hard counter with 1940s era technology, is all that matters.
From the perspective of Japanese admirals, over 4 years of war, they faced 8 times the warships produced during the entire prewar period. This is the issue, their battle plans could not scale to handle this. Had the Americans been building carriers at a steadier rate the entire time, the Japanese would never have attacked. The rate of increase turned out to be a strategic surprise that doomed the Japanese side of the war.
Predictions for AI:
It’s frankly hard to imagine a world where an AI pause is actually negotiated. Remember, if any major party says no, nobody can afford to pause. Say it happens:
During the pause, there would be some flops limit on model scale, above which requires likely prohibitively expensive precautions.
During the pause period, people would be experimenting with below threshold ML algorithms. They might build app stores where sub AGI algorithms can be easily licensed and combined into integrated systems, where “ML microservices” give an integrated system some of the benefits of a real AGI. Probably a network* of ML microservices could be built that can perceive, interpret the environment, compare the current state to a goal state, consider many possible actions using an environment/robotics sim that is a service, and then choose the best action. It might not even be that much less effective than a “real” AGI model that is integrated for some purposes like factory work.
The app stores would also likely contain key innovations that current AI stacks are missing. A series of software intercompatibility frameworks (anyone can drive a robot with any model), cloud hosted realistic evaluation environments (these are things like realistic robotic environment sims), composable robotics backends, formally proven stack components (so robotics can be certified as life safety using new AI models), and likely cloud hosted AI improving AI services. (this is where it is possible to pay for improvements to an AI stack using a service that is cloud hosted, this is possible even with sub AGI RL models).
Note that the things I just mentioned do not exist today, everyone on autonomous cars has rolled their own duplicate version of it, with only a little bit of sharing with platforms like ROS.
During the pause period, Moore’s law continues to whatever level it is able to continue (physics is obviously an ultimate limit to an extent), but the experience curve would continue to make transistors cheaper even after they cannot be made smaller. AI models are close to embarrassingly parallel so they benefit linearly from the number of transistors.
During the pause period, ASIC architectures for AI chips are developed. On previous examples like bitcoin mining and others, ASICs have proven to be substantially faster and more powerful efficient for the same quantity of transistors.
So after the pause period, all these innovations hit all at once, and the rate of AI increase becomes very high, potentially uncontrollable. You can see why: all the obstacles to letting true AGI models immediately control robots have been smoothed away, AGI models can be used to improve each other even if a different company owns the model (that cloud hoisted AI improving service), and the realistic evaluation environments allow the new AGI models to quickly be evaluated and improved on. The compute is also faster, and the pause was likely dropped due to a war, so the new AI effort is probably flat out.
So I’m convinced. With a gears level model I think the overhang idea has a very high probability of happening if a pause occurred. It’s just super rare for there to be any pause at all historically, and there probably will not be one for AI.
Oh one bit of confusion: say there was a 5 year pause between 2030 and 2035. Am I saying that in 2040, is the amount of AI progress the same as in a 2040 with no pause? No. Obviously the pause slowed down progress, the fastest progress is when people are working on AI at full speed from 2023 to 2040. But it does create a discontinuity : 2035 after the pause is a more interesting year than the “no pause” 2030-2035 period.
*the reason a network of separate models isn’t the same as an AGI is each model gets trained separately, and it would be illegal to train the models on information from when they were assembled into a system. Each model has to remain static, validated on separate benches. And the models must operate in a human interpretable way, humans would have to be able to clearly understand both the input and output. This is how current autonomous car stacks, except comma.ai’s, already work. Assuming each model can be up to 10^26 flops—that’s quite a bit of headroom, probably easily enough to do a lot of “AGI” like things using a network of 10-100 subsystems, each under 10^26. The human brain works this way.
>But we don’t have to trust it, all that really matters is the aircraft carrier numbers, nothing else. As it turned out, the carrier was a hard counter to everything, even other carriers—the other ships in a carrier battle group are there to hunt submarines, supplement the carriers antiaircraft fire, and resupply the carriers.
This is not true. Carriers were powerful, yes, but also vulnerable. I point to the loss of Glorious and Samar as cases where they ended up under the guns of battleships and it didn’t go great, and frankly Samar should have been so much worse than it was. And sinking ships with airplanes is quite difficult. The total number of battleships sunk at sea by carrier planes? Two, and in both cases, it took a lot of planes.
More broadly, the growth of the American carrier fleet was because there was a war on, and any time there was a US-Japan war, the US was going to be building a lot of ships. There were a lot of carriers because carriers had reached the point of being genuinely useful (and could be built reasonably quickly, the main reason the battleship program was curtailed) but it wasn’t like the USN would have had 30+ fleet carriers in 1945 in a world with neither the treaties nor the war.
The intricacies of tradeoffs between WW2 ship classes could be argued, and was argued, for decades in books.
You’re correct that you can create a scenario where the carrier doesn’t always win, and in the confusion of ww2 sensors and communications those scenarios occasionally happened.
You’re correct that aerial weapons at the time were less effective against battleships.
I don’t think these exceptions change the basic idea that the chance of winning the pacific theater fleet battles is proportional to the number and effectiveness of the carrier launched aircraft you can field. So the total combat power of the USN in WW2 is mostly proportional to the carrier number, and the rate of increase is exactly the post overhang example asked for.
Note also overhang does not mean catch up. The timeline with an artificial pause always has less potential progress than the normal timeline.
I did not look at the Washington Naval Conference as a potential example. It seems like it might be relevant. Thank you !
I doubt that would still hold for the modern world.
The moment one great power detects another is violating such an important, binding, ratified, arms treaty in a way that can’t be explained away as happenstance, they would very quickly launch a hot nuclear war.
Since it would signal that the other country’s leadership are supremely confident in their efforts, either out of lunatic overconfidence and/or because they’re genuinely approaching a breakout capability.
But even more likely, no country would dare to violate the treaty in such a way because they know the consequences would be vastly vastly greater than consequences would have been in the 1930s.
i.e. game theoretic outcomes and schelling points have changed significantly post WW2.
The Soviet Union did violate the Biological Weapons Convention, which seems like an example of “an important, binding, ratified arms treaty.” It did not lead to nuclear war.
It’s very misleading to cite that wikipedia article as an example as the actual text of the BWC only bans substances that are classified as ‘biological and toxin weapons’.
But not substances classified as ‘biodefense’, ‘defensive’, etc., capabilities.
And guess which parties the text assigns to be responsible for making that determination?
Which is the loophole that allows countries to operate ‘biodefense programs’.
i.e. I’m fairly certain the Soviet Union never in fact violated the Convention according to the letter of the law, since all it would have taken to comply was a single piece of paper from the politburo reclassifying their programs to ‘biodefense’ programs.
I’m seeing a lot of examples in this thread of the person arguing how past examples which seemingly apply don’t really apply because of some technicality. Of course the situation doesn’t exactly apply, we aren’t talking about bioweapons in the Soviet era here. The parallels in a hypothetical AI treaty are obvious here.
A key question is has the threat of anything prompted a nuclear exchange?
The answer is no.
Has the threat of even a supposed nuclear exchange from faulty sensors prompted a nuclear exchange?
No.
Nuclear weapons are very expensive to make, very hard to develop, only good at killing, and for all practical purposes pretty useless.
We still failed to several rogue countries from developing them. Of course many countries didn’t build them or are downsizing their stockpiles, but is that primarily because of treaties or because they’re very expensive and practically useless.
Try starting a nuclear exchange over China’s “cancer research” gpu clusters. Wonder how that will go.
Another key question is would an overhang exist. We don’t need to even compare this to jet rexords, we have evidence they exist in deep learning from the history deep learning! Many hardware upgrades lead to researchers quickly beating SoTA by just trying algorithms the hardwares let them. There is also a slower algorithmic overhang, just look at chess algos learning rates vs computes.
Maybe I’m reading between the lines too much, but a lot of these arguments would make sense if someone first decided governance is effective then decided on their positions.
How are these points relevant to what was being discussed?
I don’t think the opposing stance for these two question was implied.
The history of (or lack of) nuclear exchanges seems relevant to discussing whether they will be effective at enforcing treaties.
What specifically do these questions relate to in the preceding comment, the one it’s replying to? Or to Jeffrey’s comment before that?
Has there been cold war scenarios where either side should have launched a hot nuclear war ? Does the country launching the nuclear war actually win or do they die also in your scenario?
Do you know of a modern world example of mass suicide attacks? That would be similar to your reference class. Isis? Problem there is the leaders of isis didn’t strap bombs to themselves at the start of the war, which is the case for a nuclear exchange.
Suicide doesn’t have as long of a survival timeline as just letting another superpower win or an AI win. Suicide means the country launching the attack and it’s allies die in 24 hours, a country breaking AI treaties might not win for years. (Implicit assumption: only superpowers with large nuclear arsenals would break the treaty)
So the expected value of launching the nuclear war isn’t as good as bluffing and not carrying out the attack. Right? What do you disagree with on?
Do you dispute that launching a nuclear war against a country with loaded ICBMs will result in those missiles headed for your most valuable assets?
Do you dispute that most of your population will be dead or dying as soon as the missiles hit?
Do you dispute that if you hold fire, and the worst case scenario happens, it will take months to years for an AI to actually kill everyone?
Are you thinking of S risks, where death is preferable to eternal torture?
I think all these claims are incorrect. First, estimates of damage from nukes are very likely to be hugely (and intentionally) overblown, the same way as pre-WWII estimates for strategic bombing were off by an order of magnitude. Second, even ignoring that, current arsenals (only warheads deployed on ICBMs, other are irrelevant in this scenario) are not sufficient for counter-population strike. Destroying large cities does not destroy the nation. Third and most importantly, leadership ordering the first strike will surely survive! They just move to some remote location before, and then claim that the other side attacked first.
Quick fact check: atomic scientists cites this paper which claims 360 million deaths between Russia and the USA. That’s 75% of the current population. This pattern of unacceptable losses goes back, this source says 274 million dead in 1964, the USSR + USA population at that time was 417 million. So 65% in 1964.
You are correct that technically 25% of the population survive, and the prewar leadership could try to have their friends and family hide and they might survive.
Keep in mind that the distribution of losses won’t be even. A powerful nation requires a huge pool of specialists with unique skills that not everyone is trained in. Disproportionately more specialists will be killed, especially engineers and technicians and soldiers and so on. The survivors will likely miss skillsets and obviously all the distribution system to even allow prewar populations to exist is gone, so the survivors will likely be forced to flee to subsist as refugees in neighboring countries.
This outcome is the complete destruction of the military and economic power of the nation—even if everyone isn’t dead, there is going to be essentially no GDP and no means to resist outsiders doing whatever they want. That sounds like national suicide to me, what do you think?
Note also in a scenario of increasing tensions over AI, all the parties would be scaling their nuclear arsenals and preparing measures to continue to fight until the other party is annihilated. This would mean more deployed warheads probably on more forms of delivery vehicle that arms limitation treaties currently restrict. (like stealth cruise missiles)
Again, that some estimates are given in papers doesn’t mean they are even roughly correct. But if they are—then no, that scenario is not suicide. There are some nations now which have lower GDP per capita than USA had two centuries ago.
As for defense—well, that definitely wouldn’t be a problem. Who and why will be willing to invade a big and very poor country, leaders of which claim they still have some nukes in reserve?
Nuclear exchanges won’t end the world, but they will make the nations that started them forever irrelevant. If the top 100 major cities in the U.S. were wiped out, the U.S. would become the next Roman Empire for all sakes and purposes, an echo of the past. That represents an immense loss in GDP and a complete destruction of the economy.
Also you can’t have it both ways,
Either a nuclear exchange is deadly and a reason to abide a treaty (and suicidal enough that leaders won’t actually do it) or it’s not and people won’t abide by it.
The first claim is true—but ruling a third world nation is still better than being dead and ruling nothing. If the leadership has Eliezer-level conviction that AI would kill everybody, then the choice is clear. The second isn’t—destroying the ability to build AI is much easier, so the reason for abiding the treaty is not “we all die” but rather “we become much poorer and don’t get the AI anyway”.
Did you skip over reading some part of the comment? Or do some parts seem confusing?
If you read and understood all of it, then writing down dozens of rambling questions doesn’t seem to make sense.
A suicidal nuclear war seems highly improbable.
I was trying to establish where we disagree and if the disagreement can be resolved by citing facts.
Could you help me by showing in quotes where you believe I “rambled”. I see each argument building on the next, can you show me how it rambles?
Here’s an outline:
Nuclear war is suicide
Suicide for national leaders hasn’t been practiced as a warfare strategy
Expected value of nuclear war is worse than dying to AI
Do you believe a nuclear war is suicide?
Are you thinking of S risks?
Update: I thought of a new one. Are you thinking government leaders will kill their nation and themselves altruistically? Since if they die, and the superpower building ai dies, other countries live and just have to deal with nuclear winter and fallout which is probably survivable. While the AI might kill everyone.
I don’t disagree?
The game theoretic outcome, in the unlikely case where one nation is hellbent on achieving a breakout of a major arms treaty in modern conditions with thousands of WMDs stockpiled, is not something you even touched on in the parent.
I’m not sure how adding on to a historical parent example and extrapolating to the world of 2023 counts as ‘disagreement’.
If you disagree with the extrapolation in the child comment then you need to write down why before asking further questions.
Hence why asking dozens of questions right off the bat, when it’s unclear what you were disagreeing about, makes no sense.
So today we have Russia violating international law openly, China running concentration camps, and the US contributing to climate change without any serious intent to stop. Oh and the West seems to be in a proxy war with Russia and Iran with Israel. This doesn’t look like a world of multiple parties afraid to offend the other, knowing it will be nuclear war if they don’t.
Can you point to examples that support your general idea that the world is closer to a world government and moving away from sovereign powers that compete and do what they want? I am not a geopolitical expert, I picked history because it seems to show a stable long term trend over decades. Or succinctly, “the outcome was X over N years, why would it change to Y?”
My disagreement is that I think history will repeat and nuclear threats will be dismissed. I think any AI treaties will be worked around like in the past and it will be a competition until the end.
I think the current events show that is what is happening today, with increasing competition that will lead to AI races.
How does ‘look like’ relate to the actual views and decision making of the leadership of any country?
People can talk one way and walk the other way. And you don’t exactly seem like someone who has the inside scoop in major world capitals so even the talk you’ve heard is likely several steps removed.
So to summarize, you believe that the parties have or will reach secret international agreements with each other and will not compete over AI like in past international arms races? Has something changed in the world to make this happen now but not then? Like better communications tech?
Does any published evidence exist to support your belief or is it all secret?
What is being ‘summarized’?
I don’t think I’ve expressed such a belief in the previous comments?
This is the belief I gathered from your most recent reply, where you said:
Ergo I believe you are saying I cannot use historical evidence, since it is 2023, and I can’t use “the superpowers are openly committing violations of international law and Russia and the USA are in a proxy war” as evidence since I don’t know what world leaders say to each other privately.
Ergo, based on what reasoning?
Can you actually lay out the argument, step by step, in writing?
I would be open to a dialogue if you want to discuss this further.
I’m not seeking out a further dialogue, just the actual arguments/reasoning/etc. behind your first reply, so that I can evaluate whether any of this has a logical basis.
Frankly, as of right now there’s almost nothing for me to base a decision upon since it’s been a pretty one-sided back and forth.
The “actual argument” is that MAD has existed since the 1960s, so about 65 years, and the United States/Soviet Union/China have done whatever they want except invade each other. Including many things another side hates. “Don’t do X or I will nuke” has not been an effective threat.
The most recent round of this was 2022, when Russia has threatened to use nuclear weapons many times and it has not been an effective threat.
https://en.m.wikipedia.org/wiki/Nuclear_risk_during_the_Russian_invasion_of_Ukraine
A threat over AI is another empty threat for game theoretic reasons which you can read up thread.
How do you even know that has been threatened, by the actual leadership of any country, for whatever you believe ‘X’ to include?
To be entirely clear and direct, you are still not writing down actual arguments, just your opinions and guesses on world affairs.
From the linked article:
I feel like we’re going in circles, so I will just lay it out step by step and you can determine where your getting stuck:
What leaders talk about in public is not identical to what they talk about in private
and even that is not identical to their actual views.
And even their actual views are not identical with their real world decisions. Because they are constrained by hundreds or thousands of actors in a complex system.
Unless you have some super special knowledge you can’t even complete link 1 of this chain.
Therefore this line of argumentation cannot be developed, limiting anyone to just guessing the inferential gaps.
We can of course make an unlimited number of guesses, but since we can’t outweigh each other, this line of discussion wouldn’t be able to lead anywhere.
You said :
https://www.state.gov/u-s-countermeasures-in-response-to-russias-violations-of-the-new-start-treaty/
I don’t see where the private communications is relevant here to your claim. Your claim is brittle in that only one example is needed to falsify it, which the above example seems to do.
Huh?
This comment is showing, on my screen, as a reply to my comment here.
Which was a response to your comment here.
This is worded as if it was intended as a reply for something else. What relation does it have to the previous two comments?
I realized it was pointless to argue if a public nuclear threat was ‘real’ or empty, since no one can know that until 20+ years from now, and then you would argue that it’s ancient history. So i went back to the root argument and falsified it. In some of my prior edits I have been trying to explain you’ve made a really fragile claim fundamentally. That the whole idea of needing “equal evidence” is only true if both claims are equally probable.
For example, “coin will come up A” and “coin will resolve B” have near equal probability. “UFOs are real” and “UFOs are not real” do not.
Given a prior of “no nuclear war for 65 years”, “a nuclear war will start on the first treaty violation” is similar to the UFO claim in that it is not probable.
What ‘root argument’? And to end the discussion, just leaving this deep comment chain suffices, no need for theatrics.
The first few times I could overlook some oddities, but now my patience is exhausted so I’m putting my foot down and insist you not jump around all over the place.
It at best appears like a bizarre thinking process and at worst as someone side-stepping whatever is inconvenient to them.
The past few especially seem to me like dodging the actual substance.
I think it would be useful to examine cases where important patents for Input X expired and prices came down quickly, allowing Input X to be used to produce much more of Product Y.
I’m curious why the summary is “No” when afterwards you provide the example of land speed records. Are you not counting it because of your argument that jet engines were pushed on by a larger independent market, while large-scale AI hardware would not if large-scale AI was banned?
I would have preferred a less concise summary such as “we looked at the most-like-this N things, 0 matched, 1 barely”.
Disclaimer: did not read the thing in full, skimmed many parts. May have missed an explanation.
Rapid conquests are often examples of warfare tech overhangs IMO.
Have you considered the brain as a possible example, though evolved instead of engineered? Gradual increase in volume across the last six million years, but with technological stagnation for long stretches (for example, Homo erectus’ stone tools barely changed for well over a million years). Then some time in the last hundred thousand years or so, we got accelerating technological progress despite steady or decreasing brain size. Is it better algorithms (via genetics)? Better data (cultural)? Feedback loops from these leading to larger population? Unclear, but the last, rate-limiting step wasn’t larger or faster brains.
And I think the idea of the rate-limiting step, rather than overhang, is exactly the key here. In your post you talk about S-curves, but why do you think s-curves happen at all? My understanding is that it’s because there’s some hard problem that takes multiple steps to solve, and when the last step falls (or a solution is in sight), it’s finally worthwhile to toss increasing amounts of investment to actually realize and implement the solution. Then, we see diminishing returns as we approach the next wall that requires a different, harder set of solutions. In time each one is overcome, often for unrelated reasons, and we have overhang in those areas until the last, rate-limiting step falls and we get a new s-curve.
Consider the steam engine, first given a toy demo about two and a half millennia ago by Archytas. Totally impractical, ignored, forgotten. Then we developed resource and compute overhang (more material wealth, more minds in the population, greater fraction of minds focused on things other than survival, better communications from the printing press and shared Latin language among scholars). We developed better algorithms (algebra, calculus, metallurgical recipes for iron and steel, the scientific method, physics). Then, and only then, did James Watt and his contemporaries overcome the last hurdle to make it practical enough to kickstart the s-curve of the industrial revolution that we’re still riding to this day.
Your post reads, to me, as saying, “Better algorithms in AI may add new s-curves, but won’t jump all the way to infinity, they’ll level off after a while.” Which is a reasonable observation and true enough for the effects of each advance. But at some level that’s almost the same as saying, “There is compute overhang,” because both mean, “Available compute is not currently the rate-limiting step in AI development.”
Now, you can go on from there to debate where or when a given s-curve will level off. You can debate whether the fact that each AI s-curve increases available intelligence for problem solving makes AI’s expected trajectory different than other technologies. Faster planes don’t invent their successors, and we can only produce so many aeronautical engineers to address the successively-harder problems, but if AI hits a point of “We can make a new mind as good as the best human inventor ever at near-zero cost and point it at the next AI problem AND the next hardware problem AND the next energy problem AND etc., all at 1000x the speed of neurons” it’s not quite the same thing. Regardless, you don’t need to address this to discuss the idea of compute overhang.
I think S-curves are not, in general, caused by increases in investment. They’re mainly the result of how the performance of a technology changes in response to changes in the design/methods/principles behind it. For example, with particle accelerators, switching from Van der Graaff generators to cyclotrons might give you a few orders of magnitude once the new method is mature. But it takes several iterations to actually squeeze out all the benefits of the improved approach, and the first few and last few iterations give less of an improvement than the ones in the middle.
This isn’t to say that the marginal return on investment doesn’t factor in. Once you’ve worked out some of the kinks with the first couple cyclotrons, it makes more sense to invest in a larger one. This probably makes S-curves more S-like (or more step like). But I think you’ll get them even with steadily increasing investment that’s independent of the marginal return.
https://en.m.wikipedia.org/wiki/Swanson’s_law
So Swanson’s law is an observation for solar panel cost, where each increase in production volume results in lower cost and it is driving an S curve.
It seems like there would be 2 separate effects running here: the S curve like technology improvement to photovoltaic cells, and as production volume increases, greater and greater automation is justified.
Note also you would expect that for silicon PV we are well into the diminishing returns area of the curve, yet costs continue to decline.
https://en.m.wikipedia.org/wiki/Solar-cell_efficiency
Eyeballing the plot..well....it actually looks kinda flat. Like increased solar cell volume is leading to scaling r&d investment and leading to almost linear efficiency improvements with time.
I would argue that AI inference hardware production would be an example of something that should benefit from the learning effect and lead to a similar S curve adoption of ai, totally decoupled from the r&d effort for the model capabilities.
Investment scaling with volume looks like an important effect.
You’re right, I was switching between performance s-curves and market size s-curves in my thinking without realizing it. I do think the general point holds that there’s a pattern of hit minimum viability --> get some adoption --> adoption accelerates learning, iteration, and innovation --> performance and cost improve --> viability increases --> repeat until you hit a wall or saturate the market.
The post is mostly not about either performance s-curves or market size s-curves. It’s about regulation imposing a pause on AI development, and whether this would cause catch-up growth if the pause is ended.
Stacked s-curves can look like a pause + catch-up growth, but they are a different mechanism.
True, that was poor framing on my part.
I think I was thrown by the number of times I’ve read things about us already being in hardware overhang, which a pause would make larger but not necessarily different-in-kind. I don’t know if (or realistically, how much) larger overhangs lead to faster change when the obstacle holding us back goes away. But I would say in this proposed scenario that the underlying dynamics of how growth happens don’t seem like they should depend on whether the overhang comes from regulatory sources specifically.
The reason I got into the whole s-curve thing is largely because I was trying to say that overhangs are not some novel thing, but rather a part of the development path of technology and industry generally. In some sense, every technology we know is possible is in some form(s) of overhang, from the moment we meet any of the prerequisites for developing it, right up until we develop and implement it. We just don’t bother saying things like “Flying cars are in aluminum overhang.”
I’m pretty confused by your post. All your examples seem like good examples of overhangs but you come to the opposite conclusion.
I had a similar reaction, and I actually think the nuclear example is a clear sign that we are in a design overhang for nuclear reactors. We’ve developed multiple generations of better nuclear technologies and mostly just not used them. As a result, the workforce and mining and manufacturing capabilities that would have existed without the regulatory pause have not happened, and so even if regulations were relaxed I would not expect to catch up all the way to where we would have counterfactually been. But if we suddenly started holding nuclear to only the same level of overall safety standards as we hold other power generation, we would get slow growth as we rebuild a whole industry from scratch, then faster growth once it becomes possible to do so. (Or not, if timelines make solar+storage cheap faster than nuclear can ramp up, but that’s a whole different question). And no, it wouldn’t be 10^6 times cheaper, there’s a floor due to just cost of materials that’s much higher than that. But I would expect some catch-up growth.
The examples are things that look sort of like overhang, but are different in important ways. I did not include the hundreds of graphs I looked through that look nothing like overhang.