In thinking about how you might identify future pandemics by sequencing wastewater, you might have a goal of raising an alert before some fraction of people were currently infected. What you’re actually able to observe, however, are sequencing reads, several steps removed from infection rates. Can we use covid data to estimate how the fraction of people currently infected with some pathogen might translate into the fraction of wastewater sequencing reads that match the pathogen?
RNA Viromics of Southern California Wastewater and Detection of SARS-CoV-2 Single-Nucleotide Variants (Rothman et al 2021) is the closest study I know in this area, though it wasn’t exactly what they were trying to answer. They took many samples of municipal wastewater, extracted the RNA, filtered it to increase the fraction of the RNA corresponding to viruses, and then sequenced it.
(They also did several other things, including enriching some samples for respiratory viruses, but here I’m only looking at the unenriched data.)
They got 795M sequencing reads, 337 of which they identified as covid. This means the fraction of all reads that were covid (the “proportional abundance”) was 4e-7. There’s a typo in the paper where they say this is “0.0004%”, but I wrote to the author to ask about it and they confirmed it was a missing zero.
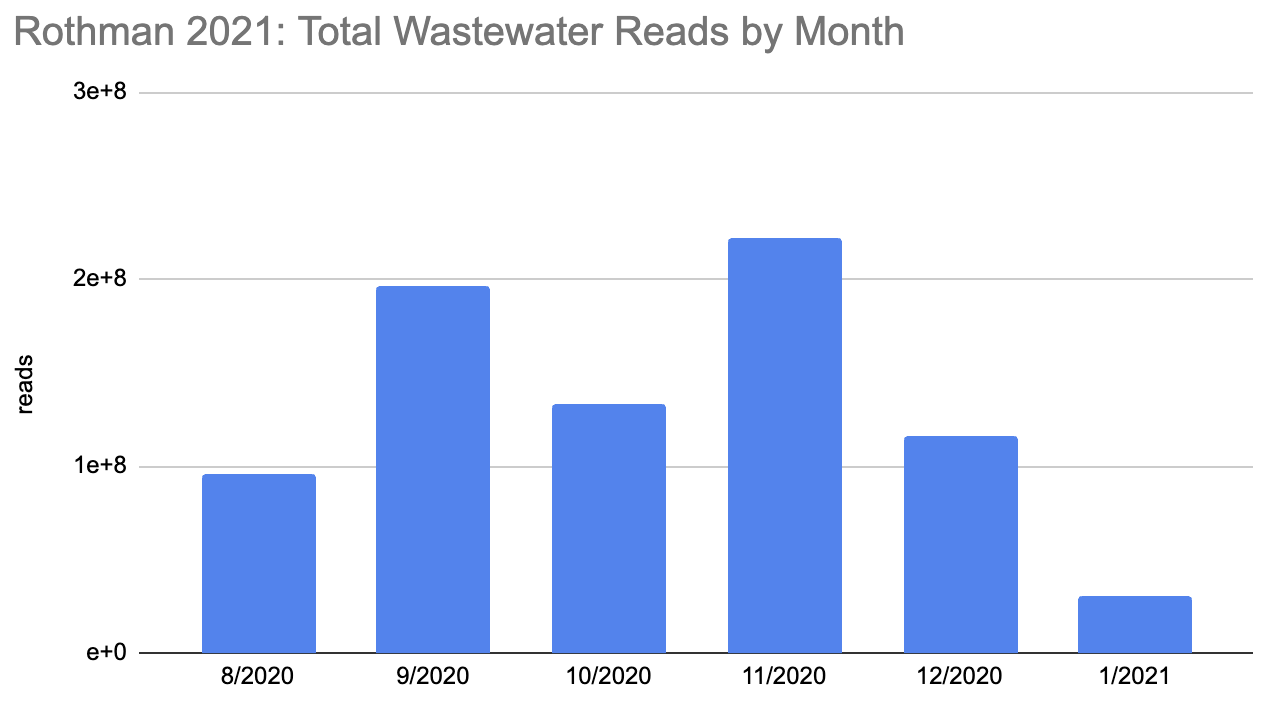
How many people were infected during this period? The first tricky thing in answering this question is that the sequencing quantity wasn’t uniform over this period:
Rothman
2021 SF4_sample_metadata: xlsx
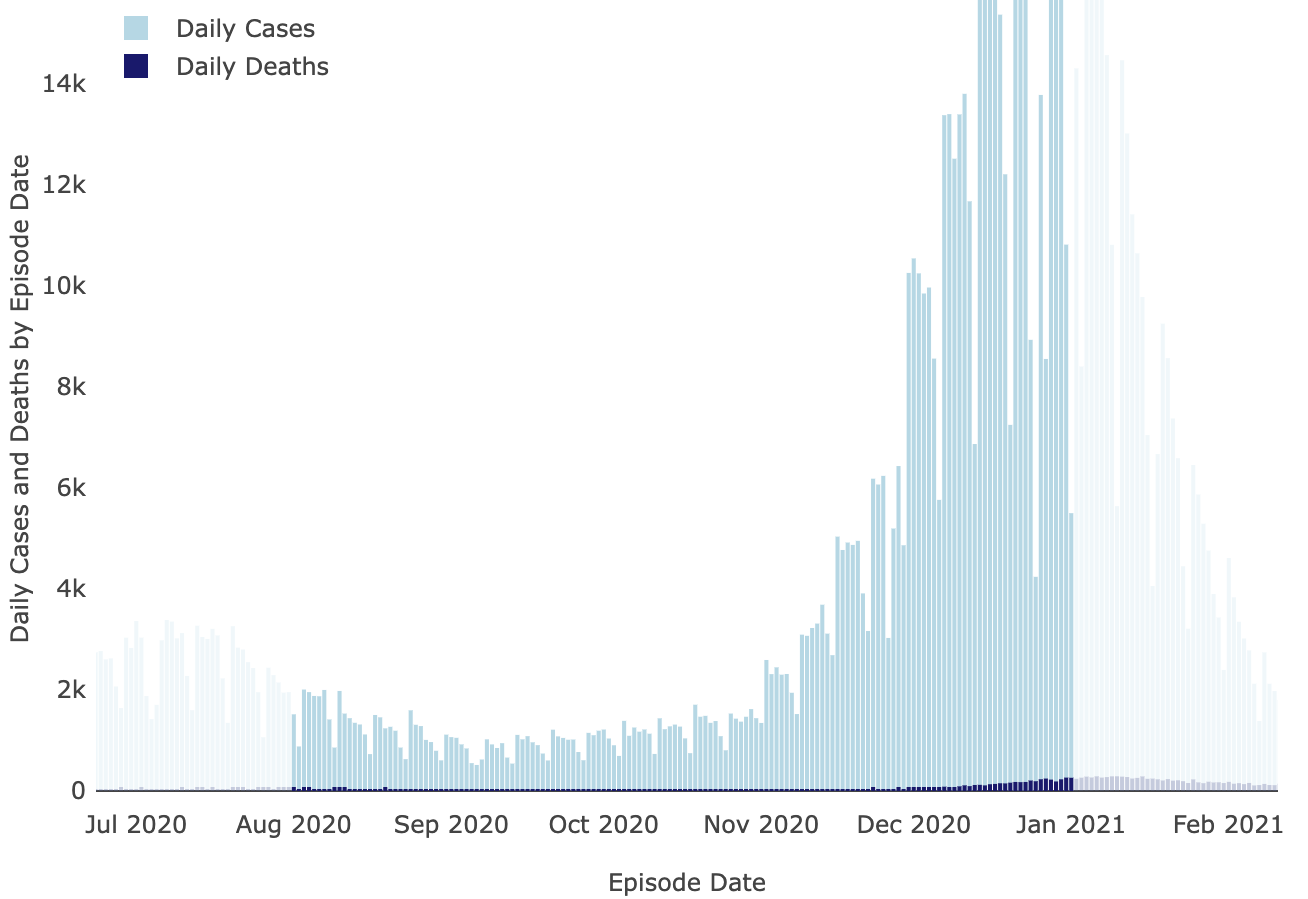
And neither were covid cases:
LA County Covid
Dashboard
The paper accounted for the variability in confirmed cases by looking at the relationship between the number of cases in the county served by each water treatment plant and the amount of covid they measured in their samples using qPCR. Because qPCR gives you much more precise estimates for a given cost, they were able to quantify the covid composition of 85 of their samples across seven plants:
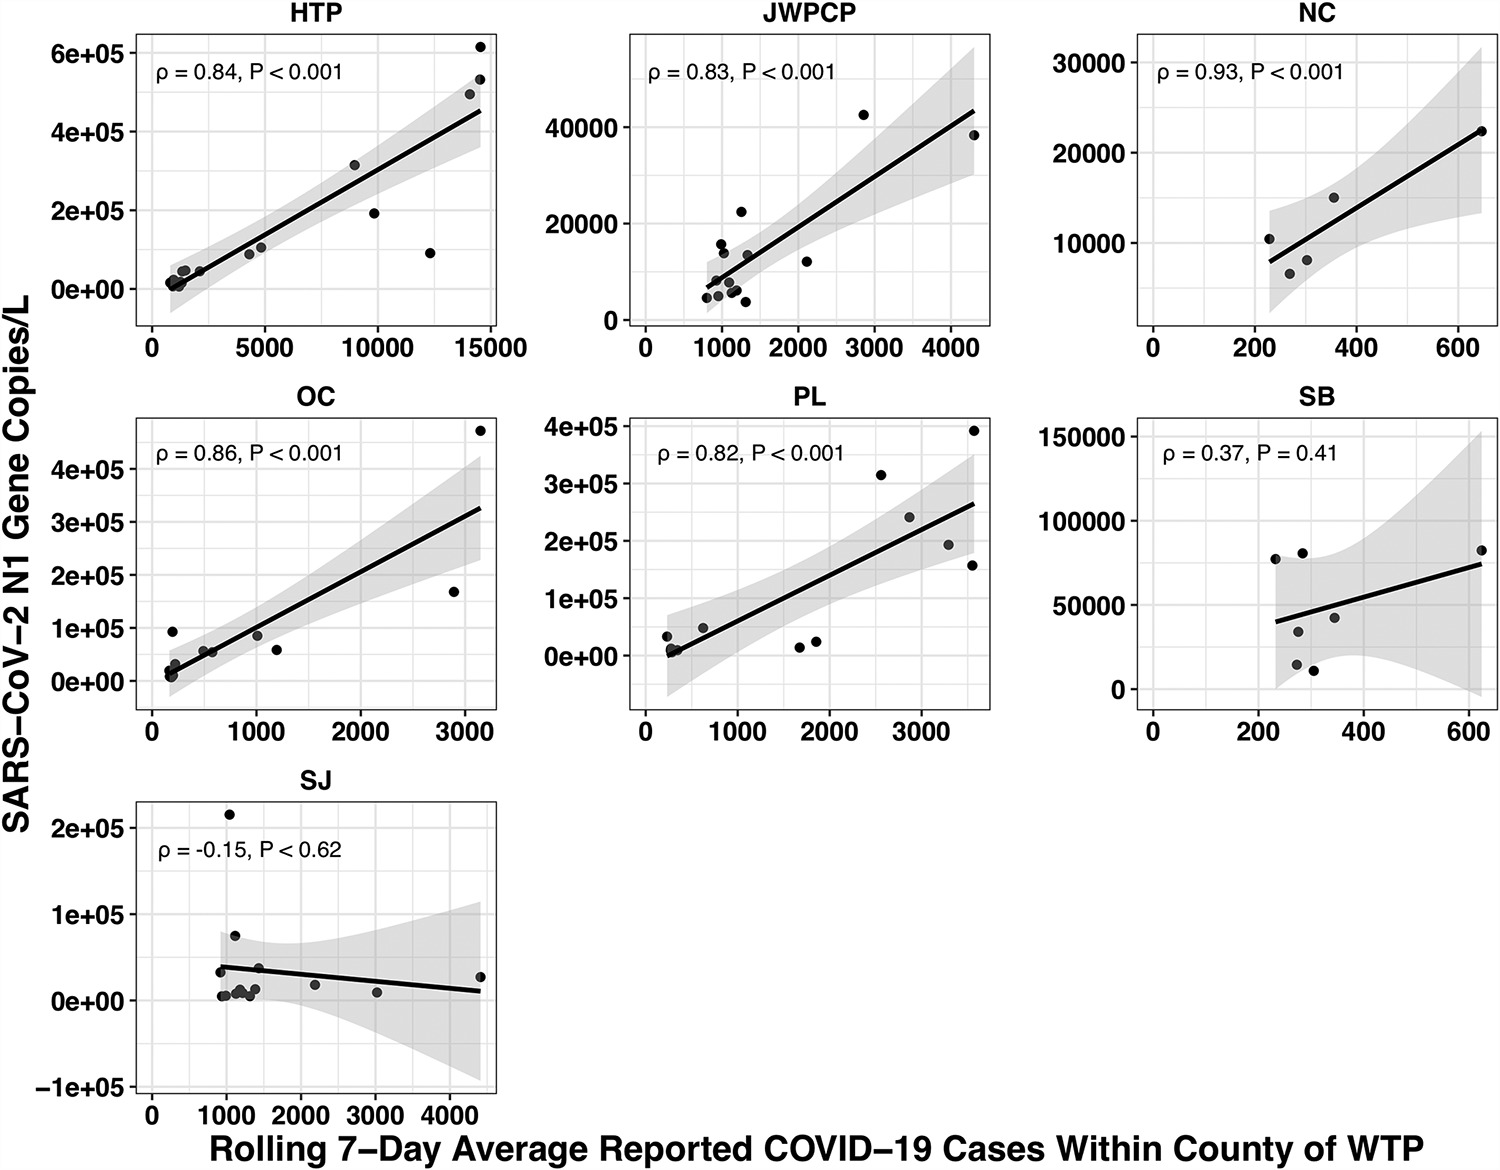
(You might be wondering: if qPCR is cheap and precise why not use it directly in looking for new pandemics? Why invest so much effort and money in sequencing? The issue with qPCR is that it’s a method for checking how much of a specific sequence is present in a sample. That means you have to already know what you’re looking for, and probably wouldn’t be able to catch something novel.)
Let’s recreate this chart, but quantify by the fraction of reads that match covid instead of qPCR. I identified the reads by looking for exact matches to a few of the length-40 substrings (“40-mers”) of covid, and found 227 (code). I pulled confirmed cases from CSSE at Johns Hopkins University, computed a 7-day centered moving average, and joined it (code) with the sample metadata (SF4: xlsx). This gives us (sheet):
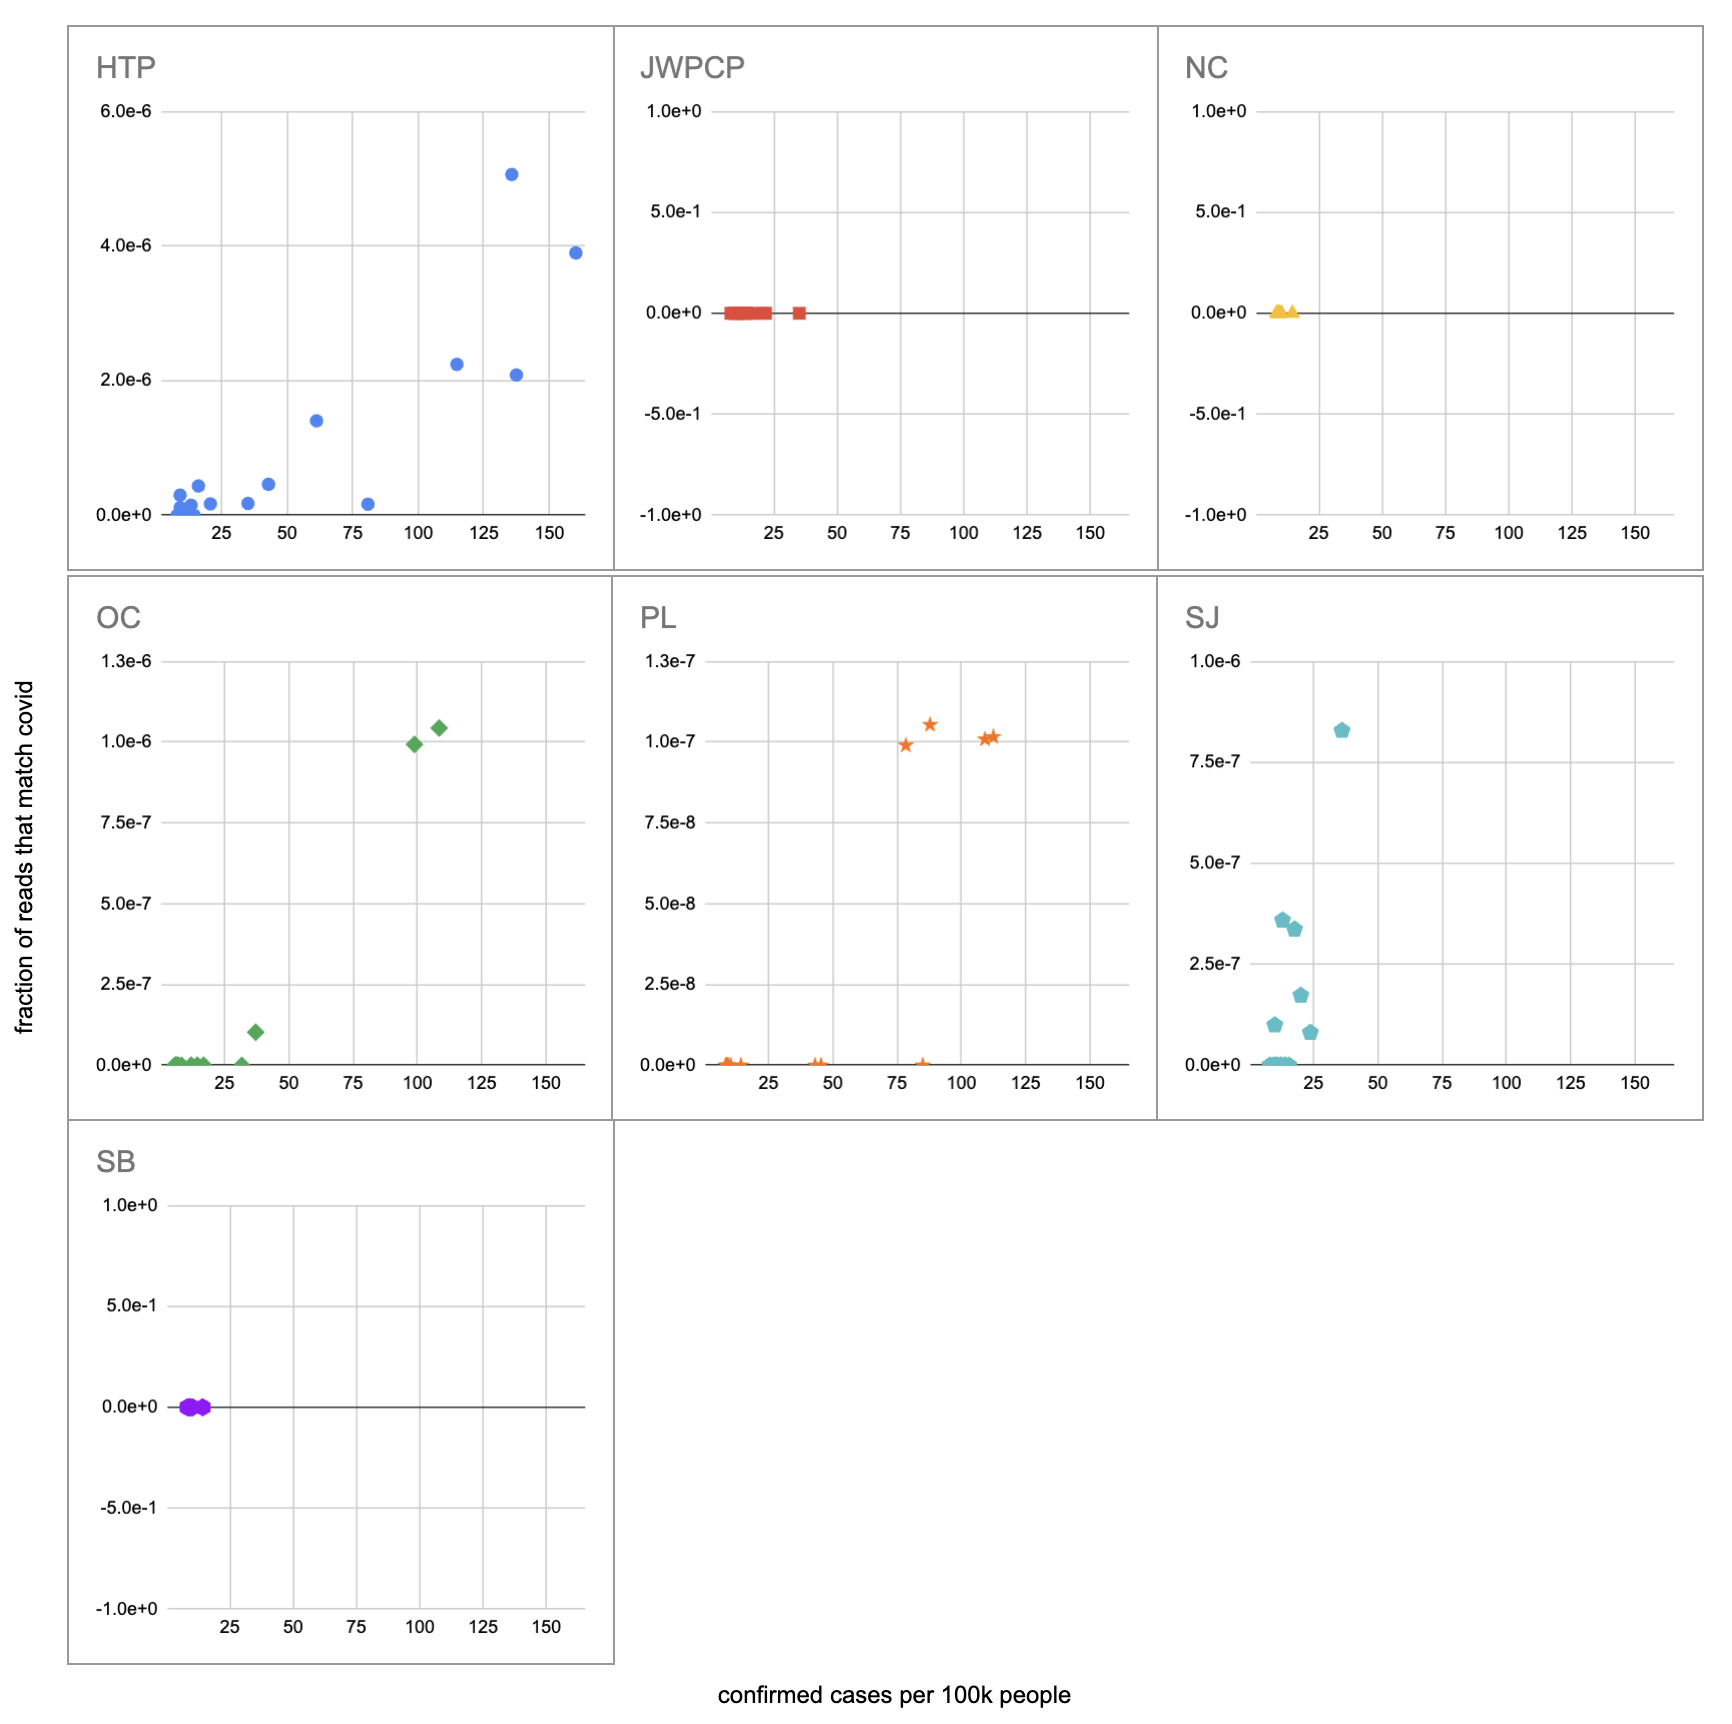
We didn’t get any reads matching covid for the JWPCP, NC, or SB plants, but this isn’t surprising because sequencing isn’t very sensitive and they only sampled those plants early in the study when covid levels were very low.
Pulling out the four plants where we do see covid, the results show a lot of variability:
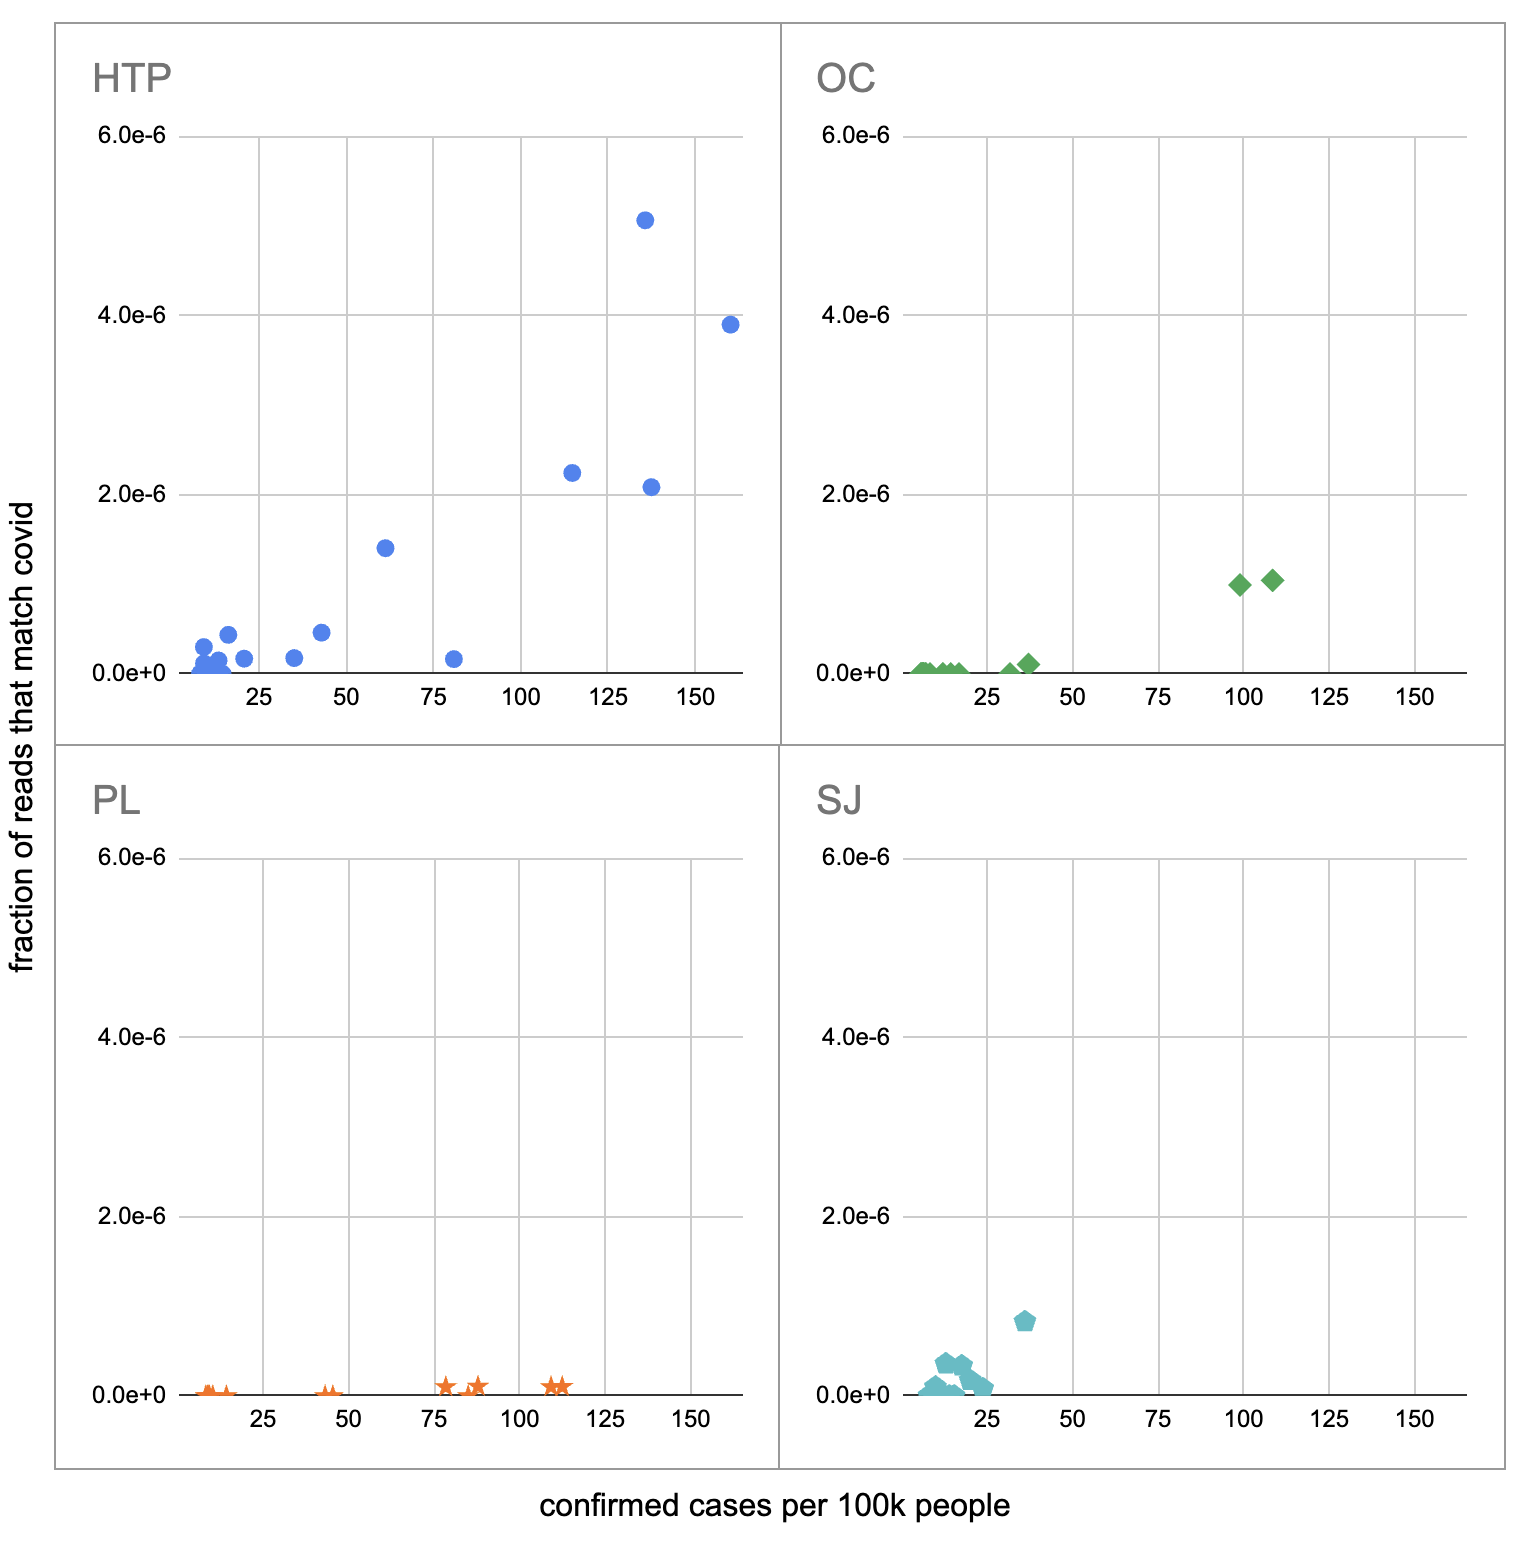
The most striking contrast is between HTP, where there’s a clear positive trend, and PL, where even as rates got to over 100 cases per 100k we never got more than one covid read per sample. We do know from qPCR there was covid in the water at PL, and that its concentration went up as cases went up, so it’s surprising that we didn’t get the number of reads we’d expect.
There’s also a disagreement the other direction, where in SJ qPCR didn’t show covid levels increasing with cases, but we do see an increase. This increase is not very robust, however, because it is driven entirely by a single sample, 12 covid reads on the last day (2020-11-18).
Fitting a linear model to these four, and the data as a whole, I see:
| Plant | Estimated reads at 100 cases per 100k |
|---|---|
| HTP | 2.2e-6 |
| OC | 8.6e-7 |
| PL | 7.9e-8 |
| SJ | 1.2e-6 |
| All | 1.3e-6 |
As a sanity check, let’s try computing this a different way, without fancy statistics. We can compare the fraction of covid reads to the read-weighted case rate. For example, if we had:
| County | Date | Total Reads | Cases per 100k |
|---|---|---|---|
| Orange | 2020-08-12 | 2.1M | 8.4 |
| LA | 2020-08-12 | 5.8M | 20.0 |
| San Diego | 2020-08-13 | 11.0M | 8.8 |
Then the read-weighted case rate, or the mean case rate ‘experienced’ by a read, is:
2.1M * 8.4 + 5.8M * 20.0 + 11.0M * 8.8
---------------------------------------
         2.1M + 5.8M + 11.0M
Which in this examples comes to 12.2 per 100k.
Calculating this for the full data I get (code, sheet) a read-weighted mean case rate of 33 per 100k. The paper found 4e-7 of reads were covid, so scaling by 100⁄33 we can add another estimate to our table:
| Plant | Estimated reads at 100 cases per 100k | ||
|---|---|---|---|
| HTP | 2.2e-6 | ||
| OC | 8.6e-7 | ||
| PL | 7.9e-8 | ||
| SJ | 1.2e-6 | ||
| All | 1.3e-6
| Read-weighting |
1.2e-6
|
|
This is quite close to what we got with linear regression, which is reassuring. Before we get too reassured, however, we should keep in mind that the PL data give much lower numbers.
Still, let’s continue on with our attempt to predict a number of sequencing reads from a number of currently infected people. So far we’ve been using confirmed cases, and not all infections are confirmed, or even noticed. The CDC estimates that from 2020-02 to 2021-09 1:4 infections were reported. And, very roughly, the typical unvaccinated person catching covid for the first time was infected for maybe ~2w. This gives us a factor of 56 (4*14), and a new table:
| Plant | Estimated reads at 100 currently infected people per 100k | ||
|---|---|---|---|
| HTP | 3.9e-8 | ||
| OC | 1.5e-8 | ||
| PL | 1.4e-9 | ||
| SJ | 2.1e-8 | ||
| All | 2.3e-8
| Read-weighting |
2.2e-8
|
|
This is a very rough estimate: is 14 days really a typical infectious period? Is 1:4 really the fraction of infections that were confirmed during this period in the catchment area of these wastewater treatment plants? Do wastewater levels lead confirmed cases, and if so by how much? Why are the levels measured at PL 20x lower than elsewhere? Is covid similar to potential future pandemics in terms of infectious period, shedding amount, stability in wastewater, etc? Is the methodology in Rothman 2021 what you’d use if you were trying to detect new pathogens? And a single sequencing read wouldn’t be enough to identify most novel pathogens, so there are additional factors I’m not getting into with later processing. Still, running through these calculations is helpful for getting a sense of how much sequencing a project like this might need.
Comment via: facebook
If I understand it right the level you measure is how much COVID-19 there is relative to other RNA viruses. Maybe some phages are very active at PL and that results in a lot more virus RNA relative to other wastewater treatment plants?
To check you might ask whether there are other viruses for PL is 20x lower in a similar way to COVID-19.
Interesting idea! I haven’t looked at the viral composition of sequencing aside from checking for covid, so that’s a good place to try and improve this estimate.
It’s been more than a decade that I was studying bioinformatics at university so I don’t know how capable the algorithms are nowadays.
What are the computing costs to identify thousands of different species within the 795M reads? If you actually want to search for new viruses you might even have to match millions of species.
There are more details in the NAO preprint (https://arxiv.org/pdf/2108.02678.pdf), but the basic idea is that if something is spreading through a population it will grow approximately exponentially in the early stages, and will ideally leave something visible in the form of exponentially increasing genetic sequences in wastewater. If we sequence deeply enough, we might be able to identify these based only on this growth pattern.
The current plan is not “map every read back to something known” but “look for things that are growing exponentially”, which is computationally much cheaper. Something like “count how often every 40-mer occurs, then run statistical analyses to identify ones that are growing exponentially, then look at those more closely”. This is much cheaper than the sequencing, though that’s a bit of a low bar since the amount of sequencing in the paper would cost maybe $10k in a single run (and likely cost them much more, since they used many smaller runs).