Multivariate estimation & the Squiggly language
(Talk given at an event on Sunday 16th of August. Ozzie Gooen is responsible for the talk, Justis Mills edited the transcript.
If you’re a curated author and interested in giving a 5-min talk, which will then be transcribed and edited, sign up here.)
Ozzie: This image is my TLDR on probability distributions:
Basically, distributions are kind of old school. People are used to estimating and predicting them. We don’t want that. We want functions that return distributions—those are way cooler. The future is functions, not distributions.
What do I mean by this?
For an example, let’s look at some of the existing COVID models. This is one of them, from the IHME:
You can see that it made projections for total deaths, daily deaths, and a bunch of other variables. And for each indicator, you could choose a country or a location, and it gives you a forecast of what that indicator may look like.
So basically there’s some function that for any parameter, which could be deaths or daily deaths or time or whatever, outputs a probability density. That’s the core thing that’s happening.
So if you were able to parameterize the model in that way, and format it in these terms, you could basically wrap the function in some encoding. And then do the same forecast, but now using a centralized encoding.
So right now, basically for people to make something like the COVID dashboard from before, they have to use this intense output and write some custom GUI. It’s a whole custom process. Moreover, it’s very difficult to write your own function that calls their underlying model.
But, hypothetically, if we had an encoding layer between the model and the output, these forecasters could basically write the results of their model into one function, or into one big file. Then that file could be interpreted and run on demand. That would be a much nicer format.
Let’s take a look at Metaculus, which is about the best forecasting platform we have right now.
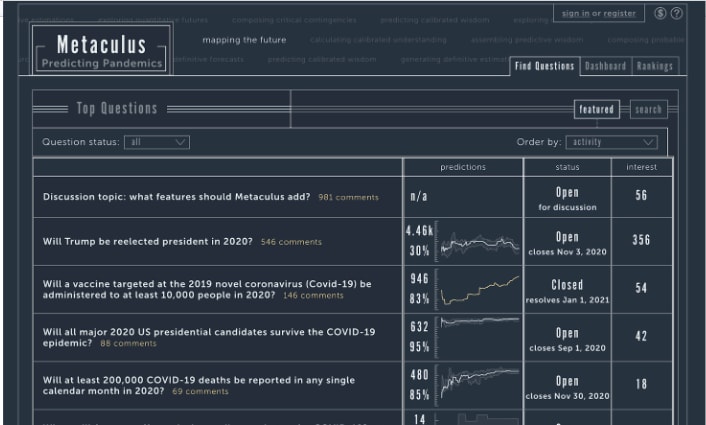
On Metaculus, everything is a point estimate, which is limiting. In general, it’s great that we have good point estimates, but most people don’t want to look at this. They’d rather look at the pretty dashboard from before, right?
So we need to figure out ways of getting our predictors to work together to make things that look more like the pretty graphs. And one of those questions is: how do we get predictors to write functions that return distributions?
Ultimately, I think this is something that we obviously want. But it is kind of tricky to get there.
So in Estimation Utopia, as I call it, we’d allow for people to take the results of their data science models and convert them into a unified format. But also, humans could just intuitively go ahead and write in the unified format directly. And if we have unified formats that are portable and could be run in different areas with different programming languages, then it would be very easy to autogenerate GUIs for them, including aggregates which combined multiple models at the same time. We could also do scoring, which is something that is obvious that we want, as well as compose models together.
So that’s why I’ve been working on the Squiggly language.
Let’s look at some quick examples!
This is a classic normal distribution, but once you have this, some of the challenge is making it as easy as possible to make functions that return distributions.
Here’s a case for any t:
We’re going to give you a normal, with t as a mean and the standard deviation of 3. This is a plot where it’s basically showing bars at each one of the deciles. It gets a bit wider at the end. It’s very easy once you have this to just create it for any specific combination of values.
It’s also cool, because once you have it in this format, it’s very easy to combine multiple models. For instance, here’s a lognormal.
For example, if I have an estimate and my friend Jacob has an estimate, then we could write a function that for every time t, basically queries each one of our estimates and gives that as a combined result.
This kind of shows you a problem with fan charts, that they don’t show the fact that all the probability amasses on the very top and the very bottom. That’s an issue that we’ll get over soon. Here’s what it looks like if I aggregate my model with Jacob’s.
Questions
Raemon: I had a little bit of excitement, and then fear, and then excitement again, when you talked about a unified format. The excitement was like, “Ah, a unified format, that sounds nice.” Then I had an image of all of the giant coordination problems that result from failed attempts to create a new unified format, where the attempted unified format becomes yet another distinct format among all the preexisting options.
Then I got kind of excited again because to a first approximation, as far as I can tell, in the grand scheme of things currently, approximately zero people use prediction markets. You might actually be able to figure out the right format and get it right the first time. You also might run into the same problems that all the other people that tried to come up with unified formats did, which was that it was hard to figure that out right at the beginning. Maybe now I am scared again. Do you have any thoughts on this?
Ozzie: Yeah, I’d say in this case, I think there’s no format that does this type of thing yet. This is a pretty unexplored space. Of course, writing the first format in a space is kind of scary, right? Maybe I should spend a huge amount of time making it great, because maybe it’ll lock in. Maybe I should just iterate. I’m not too sure what to do there.
And there are also a few different ways that the format could go. I don’t know who it’s going to be the most useful for, which will be important. But right now, I’m just experimenting and seeing what’s good for small communities. Well, specifically what’s good for me.
Raemon: Yeah, you can build the thing that seems good for you. That seems good. If you get to a point where you want to scale it up, making sure that whatever you’re scaling up is reasonably flexible or something might be nice. I don’t know.
Ozzie: Yeah. Right now, I’m aiming for something that’s good at a bunch of things but not that great at any one of them. I’m also very curious to get outside opinions. Hopefully people could start playing with this, and I can get their thoughts.
---
habryka: This feels very similar to Guesstimate, which you also built, just in programming language as opposed to visual language. How does this project differ?
Ozzie: Basically, you could kind of think about this as “Guesstimate: The Language”. But it does come with a lot of advantages. The main one is that you could write functions. With Guesstimate you couldn’t write functions. That was a gigantic limitation!
Really, a lot of Squiggly is me trying to remake for my sins with Guesstimate. With Guesstimate, if one person makes a model of how the damage from bicycling, like the micromorts that they’re taking when they bike, that model only works for them. If you wanted to go and configure it to match your situation, you’d have to go in and modify it manually. It’s actually very difficult to port these models. If one person writes a good model, it’s hard for somebody else to copy and paste it, hopefully into another programming tool. It’s not very portable.
So I think these new features are pretty fundamental. I think that this is a pretty big step in the right direction. In general text-based solutions have a lot of benefits when you can use them, but it is kind of tricky to use them.
---
Johnswentworth: I’m getting sort of mixed vibes about what exactly the use case here is. If we’re thinking of this as a sort of standard for representing models, then I should be able to convert models in other formats, right? Like, if I have a model in Excel or I have a model in Pyro, then there should be some easy way to turn it into this standard format?
On the other hand, if we’re trying to create a language in which people write models, then that’s a whole different use case where being a standard isn’t really part of it at all (instead it looks more like the actual UI you showed us).
So I’m sort of not sure what the picture is in your head for how someone is actually going to use this and what it’s going to do for them, or what the value add is compared to Excel or Pyro.
Ozzie: Yeah, great question. So I would say that I’d ideally have both data scientists and judgemental forecasters trying to use it, and those are two very distinct types of use cases, as you mentioned. It’s very possible that they both want their own ideal format, and it doesn’t make sense to have one format for the two of them. I’m excited for users who don’t have any way of making these methods intuitively at the moment.
Suppose, for example, that you’re trying to forecast the GDP of US for each year in the coming decades.
Step one is making sure that, basically, people on Metaculus or existing other forecasting platforms, could basically be writing functions using this language and then submitting those instead of just submitting point forecasts. So you’d be able to say “given as input a specific year, and some other parameters, output this distribution”—instead of having to make a new and separate forecast for each and every year. Then having the whole rest of the forecasting pipeline work with that (e.g. scoring, visualisations, and so forth).
When you do that, though, it is pretty easy to take some results from other, more advanced tools, and put them into probably very simple functions. So, for instance, if there is a distribution over time (as in the GDP example), that may be something they could interpolate with a few different points. There could be some very simple setups where you take your different Pyro model or something that actually did some intense equations, and then basically put them into this very simple function that just interpolates based on that and then uses this new format.
Johnswentworth: What would be the advantage of that?
Ozzie: It’s complicated. If you made your model in Pyro and you wanted to then export it and allow someone to play with it, that could be a tricky thing, because your Pyro model might be computationally expensive to run. As opposed to trying to export a representation that is basically a combination of a CSV and a light wrapper function. And then people run that, which is more convenient and facilitates more collaboration.
Johnswentworth: Why would people run that though? Why do people want that compressed model?
Ozzie: I mean, a lot of the COVID models are like that, where basically the running of the simulation was very time intensive and required one person’s whole PC. But it would still be nice to be able to export the results of that and then make those interactable, right?
Johnswentworth: Oh, I see. Okay, I buy that.
Ozzie: I also don’t want to have to write all of the work to do all of the Pyro stuff in this language. It’s way too much.
Johnswentworth: Usually, when I’m thinking about this sort of thing, and I look at someone’s model, I really want to know what the underlying gears were behind it. Which is exactly the opposite of what you’re talking about. So it’s just a use case that I’m not used to thinking through. But I agree, it does make sense.
---
habryka: Why call the language Squiggly? There were a surprising lack of squiggles in the language. I was like, “Ah, it makes sense, you just use the squiggles as the primary abstraction”—but then you showed me your code editor and there were no squiggles, and I was very disappointed.
Ozzie:
Yeah, so I haven’t written my own parser yet. I’ve been using the one from math.js. When I write my own, it’s possible I’ll add it. I also am just really unsure about the name.
- Quantifying Uncertainty in GiveWell’s GiveDirectly Cost-Effectiveness Analysis by (EA Forum; 27 May 2022 3:10 UTC; 130 points)
- Squiggle: An Overview by (24 Nov 2020 3:00 UTC; 61 points)
- Forecasting Newsletter: September 2020. by (EA Forum; 1 Oct 2020 11:00 UTC; 41 points)
- 2020: Forecasting in Review by (EA Forum; 10 Jan 2021 16:05 UTC; 35 points)
- 2020: Forecasting in Review. by (10 Jan 2021 16:06 UTC; 28 points)
- Forecasting Newsletter: September 2020. by (1 Oct 2020 11:00 UTC; 21 points)
- Adjusting probabilities for the passage of time, using Squiggle by (23 Oct 2020 18:55 UTC; 19 points)
- 's comment on Quantifying Uncertainty in GiveWell’s GiveDirectly Cost-Effectiveness Analysis by (EA Forum; 31 May 2022 18:48 UTC; 13 points)
Great work! It seems like this could enable lots of useful applications. One thing in particular that I’m excited about is how this can be used to make forecasting more decision-relevant. For example, one type of application that comes to mind in particular is a conditional prediction market where conditions are continuous rather than discrete (eg. “what is GDP next year if interest rate is set to r?”, “what is Sierra Leone’s GDP in ten years if bednet spending is x?”).
Thanks!
Yea; I think mixtures of continuous + discrete conditionals should open up a bunch of options. I imagine it’s hard to grok all of these without using it a bit, so I do look forward to publishing it more openly and encouraging people to “mess around”.
I think the space of options is quite massive, though the technical and academic challenges massive as well.
Here’s a link to a staging version, though one without explanation. The editor uses vim, so you need to type “i” to begin adding text.
https://5f3973242bc7c000071f50a7--distracted-mirzakhani-b102f4.netlify.app/dist-builder
This is super cool. I always wanted a programming language that would track error bounds for me. So when I write $F = m*a$ and I have an $m = 100\pm 1kg$ and and $a = 9\pm 1m/s^2$ it would track this in calculations and let me extract the propagated bounds like $F.max$. I had only uniform and Gauss distributions in minds but allowing arbitrary distributions is of course way more powerful. Also less efficient but I guess many common cases could be optimized.
Thanks!
Have you looked into other probabilistic programming languages? While Squiggle could help in the use case you are describing, Stan and PyMC3 may be usable for the case you are describing.
Squiggle would treat that similar to Guesstimate, though also make it possible to write simple functions.