As I wrote yesterday, MA is no longer reporting good data to the CDC on Lyme disease. Starting in 2019, however, MA has been publishing tick-borne disease reports. They include this misleading chart:
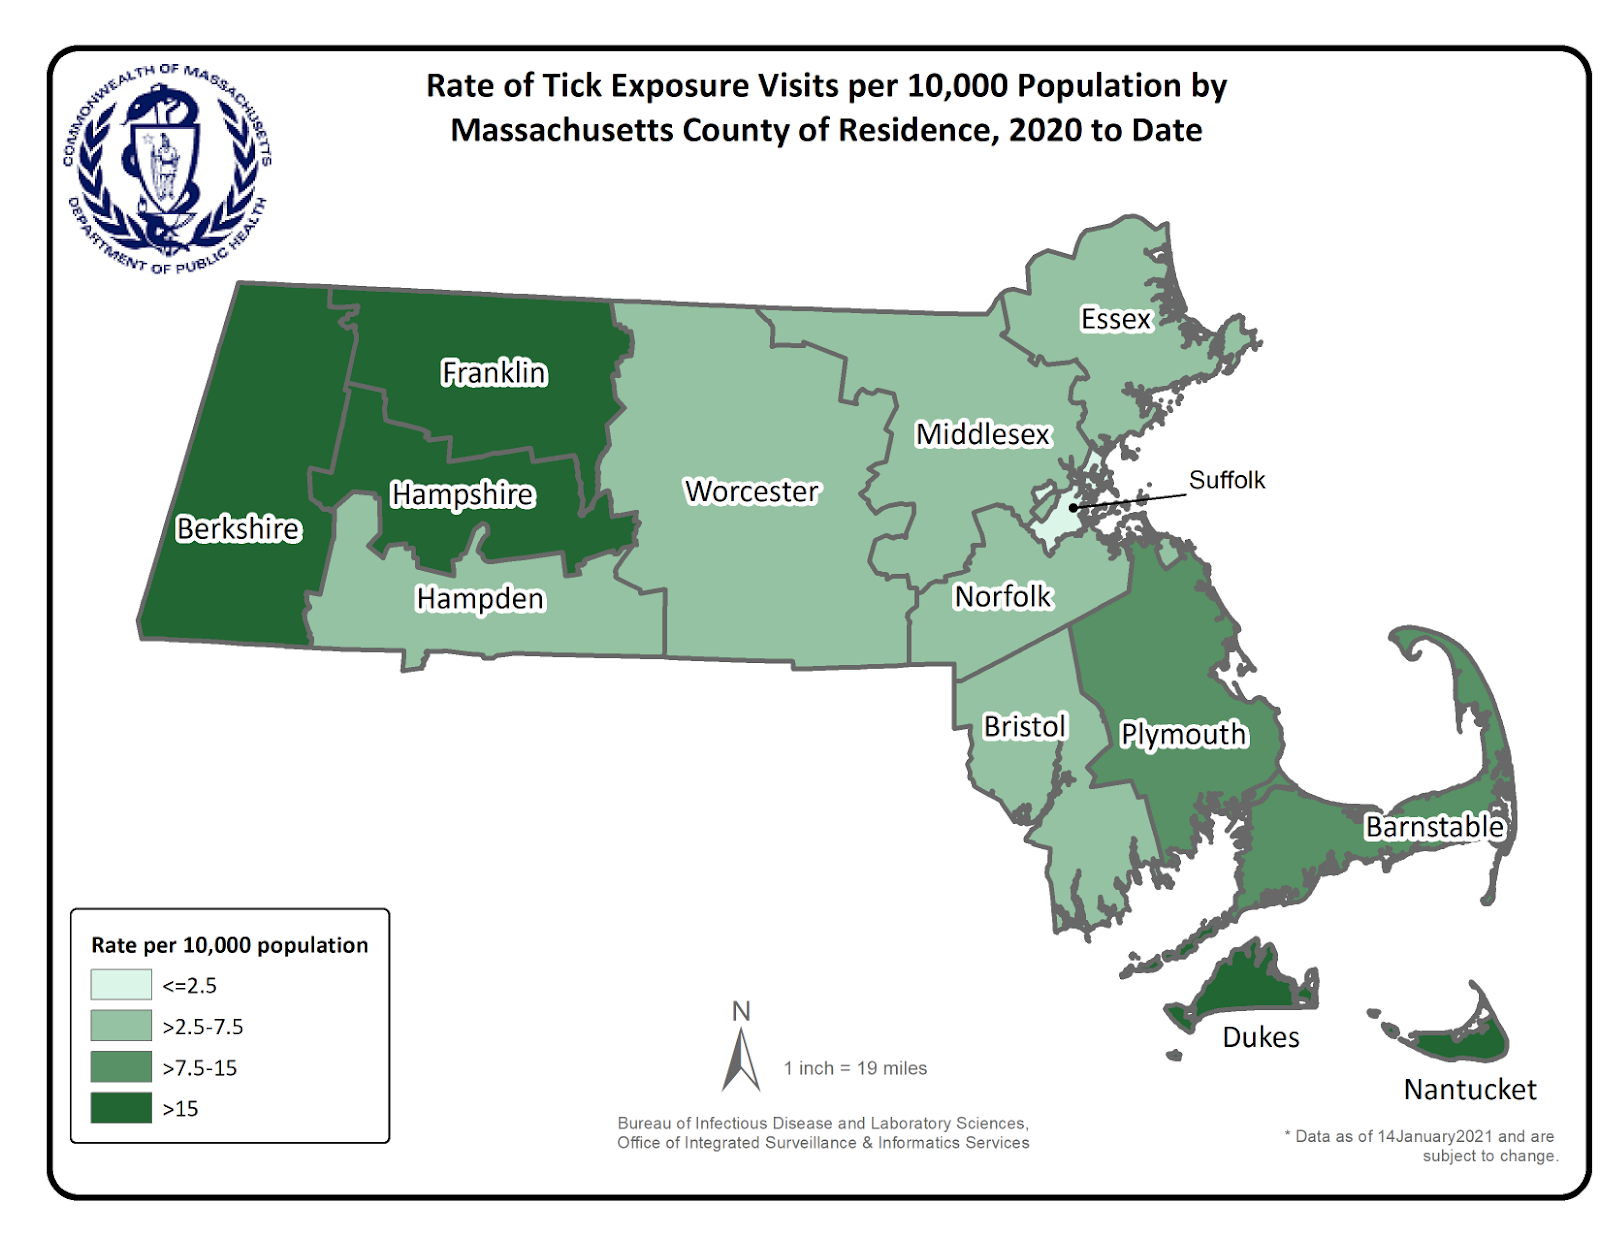
The caption includes “Although there are differences in the rate of patient visits, this shows that people are exposed to ticks throughout all of Massachusetts and should take recommended steps to reduce the chance of being bitten.”
One issue is that they’ve chosen to chart the rate of visits and not the rate of diagnoses, but the main issue is that the scale hides the degree of variation between counties. Pulling the numbers and manually dividing by population estimates, I see:
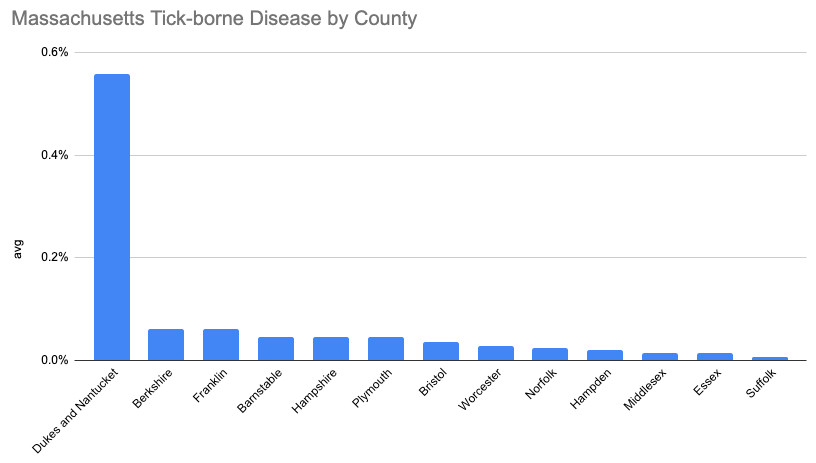
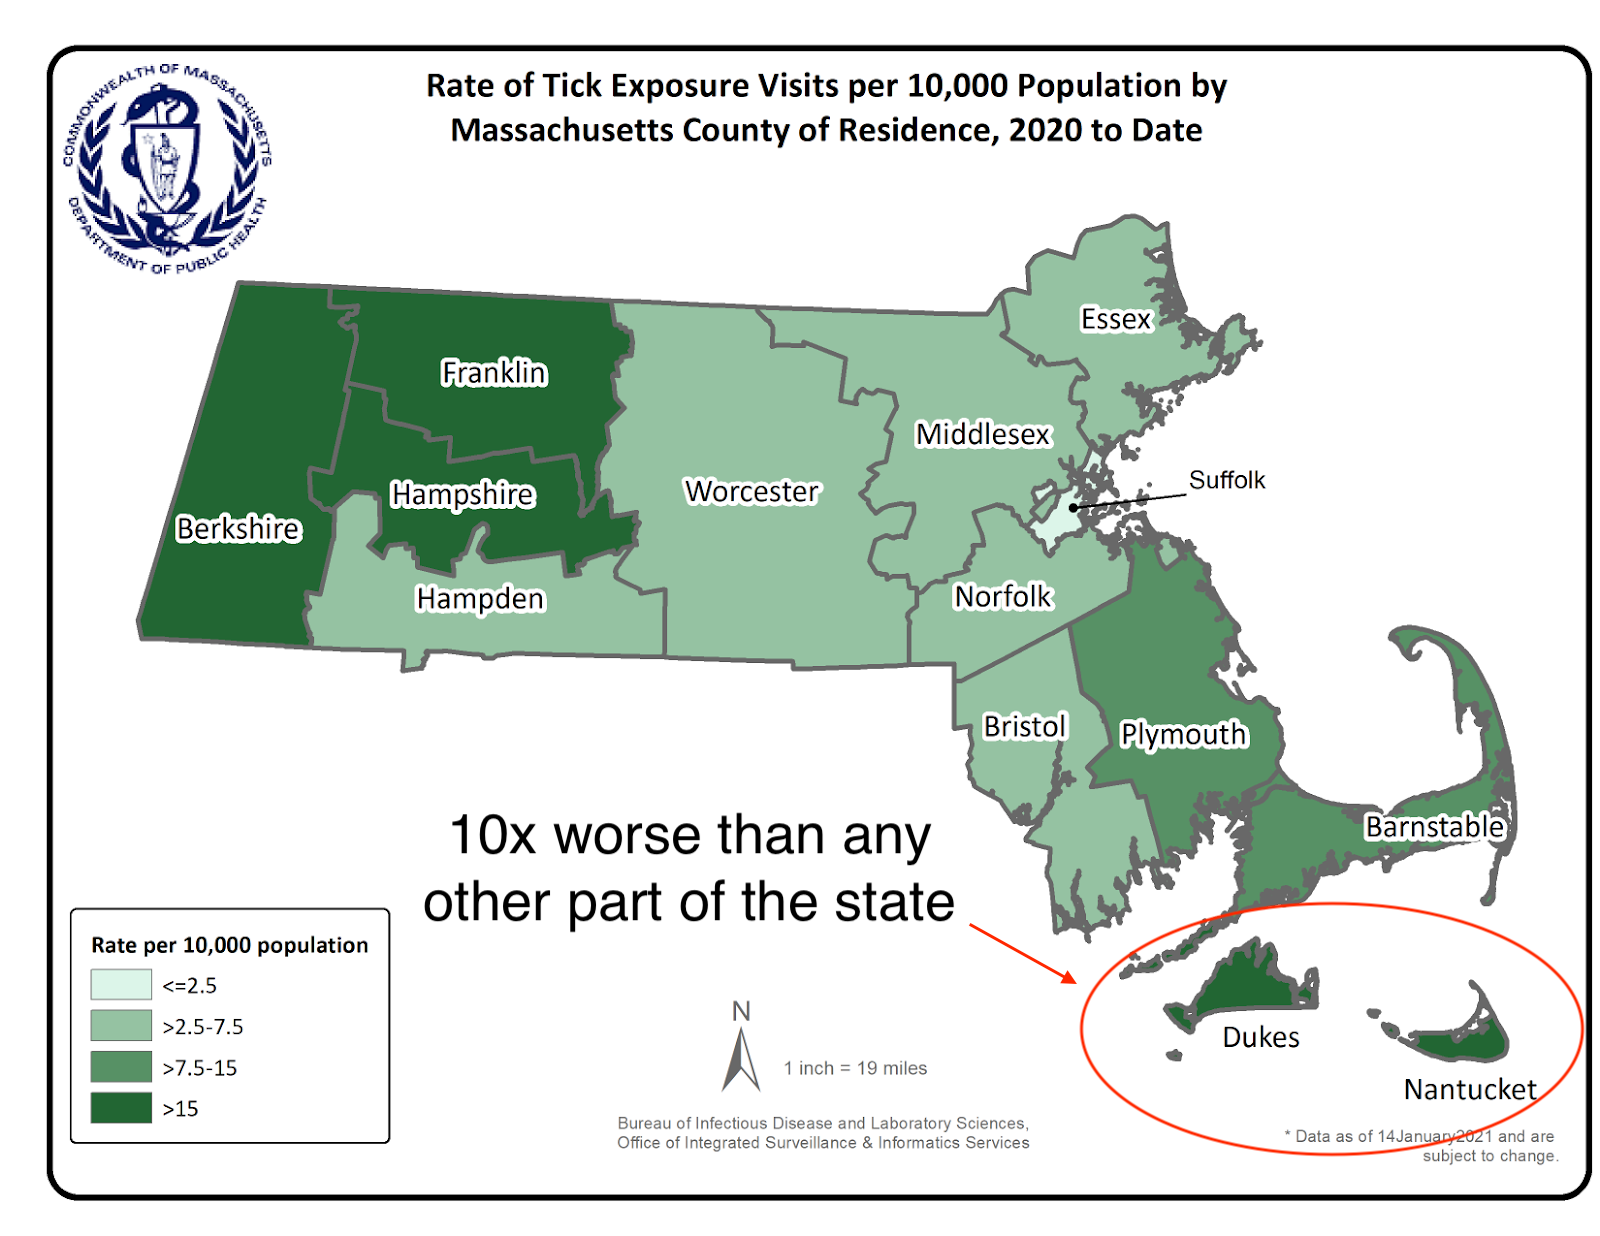
The rate in the Islands (Dukes and Nantucket Counties) is 10 times any other MA county!
(Even though these are also vacation areas, people are categorized by their home county not their infection county.)
Now, I agree with them that taking precautions is worth it when walking through tick-friendly terrain anywhere in the state. But there are still degrees of precautions, from clothes, to tick checks, to choosing different activities, to choosing other counties, and the report should emphasize the difference in risk so people can make good decisions.
Comment via: facebook
It seems that the reason for Massachusetts generally acting differently here is downstream of the state state epidemiologist taking Lyme more seriously then your average bureaucrats at the CDC:
Catherine M. Brown at the Tick Born-Disease working group:
The map downplaying Dukes and Nantucket being vacation areas however might also be the result of political fights. Given that tourism is likely an economic force there are political reasons against telling people: It’s dangerous to be outside in our vacation areas.
The note about vacation areas is pretty important. Nantucket’s population increases by 5x in the summer, and number of people who visit for shorter times is probably 20-50x the reported population.
What decisions are you making based on this? Being careful (wearing long pants, inspecting for ticks after being out, etc.) in any tick-likely habitat in the entire region seems wise, without very much variation.
Right. I initially thought that this explained the difference, but when they count a case towards Nantucket they’re only counting it if the person is a resident of Nantucket.