Lukeprog posted this today on the blog at OpenPhil. I’ve quoted the opening section, and footnote 17 which has an interesting graph I haven’t seen before.
How accurate do long-range (≥10yr) forecasts tend to be, and how much should we rely on them?
As an initial exploration of this question, I sought to study the track record of long-range forecasting exercises from the past. Unfortunately, my key finding so far is that it is difficult to learn much of value from those exercises, for the following reasons:
Long-range forecasts are often stated too imprecisely to be judged for accuracy.
Even if a forecast is stated precisely, it might be difficult to find the information needed to check the forecast for accuracy.
Degrees of confidence for long-range forecasts are rarely quantified.
In most cases, no comparison to a “baseline method” or “null model” is possible, which makes it difficult to assess how easy or difficult the original forecasts were.
Incentives for forecaster accuracy are usually unclear or weak.
Very few studies have been designed so as to allow confident inference about which factors contributed to forecasting accuracy.
It’s difficult to know how comparable past forecasting exercises are to the forecasting we do for grantmaking purposes, e.g. because the forecasts we make are of a different type, and because the forecasting training and methods we use are different.
Despite this, I think we can learn a little from GJP about the feasibility of long-range forecasting. Good Judgment Project’s Year 4 annual report to IARPA (unpublished), titled “Exploring the Optimal Forecasting Frontier,” examines forecasting accuracy as a function of forecasting horizon in this figure (reproduced with permission):
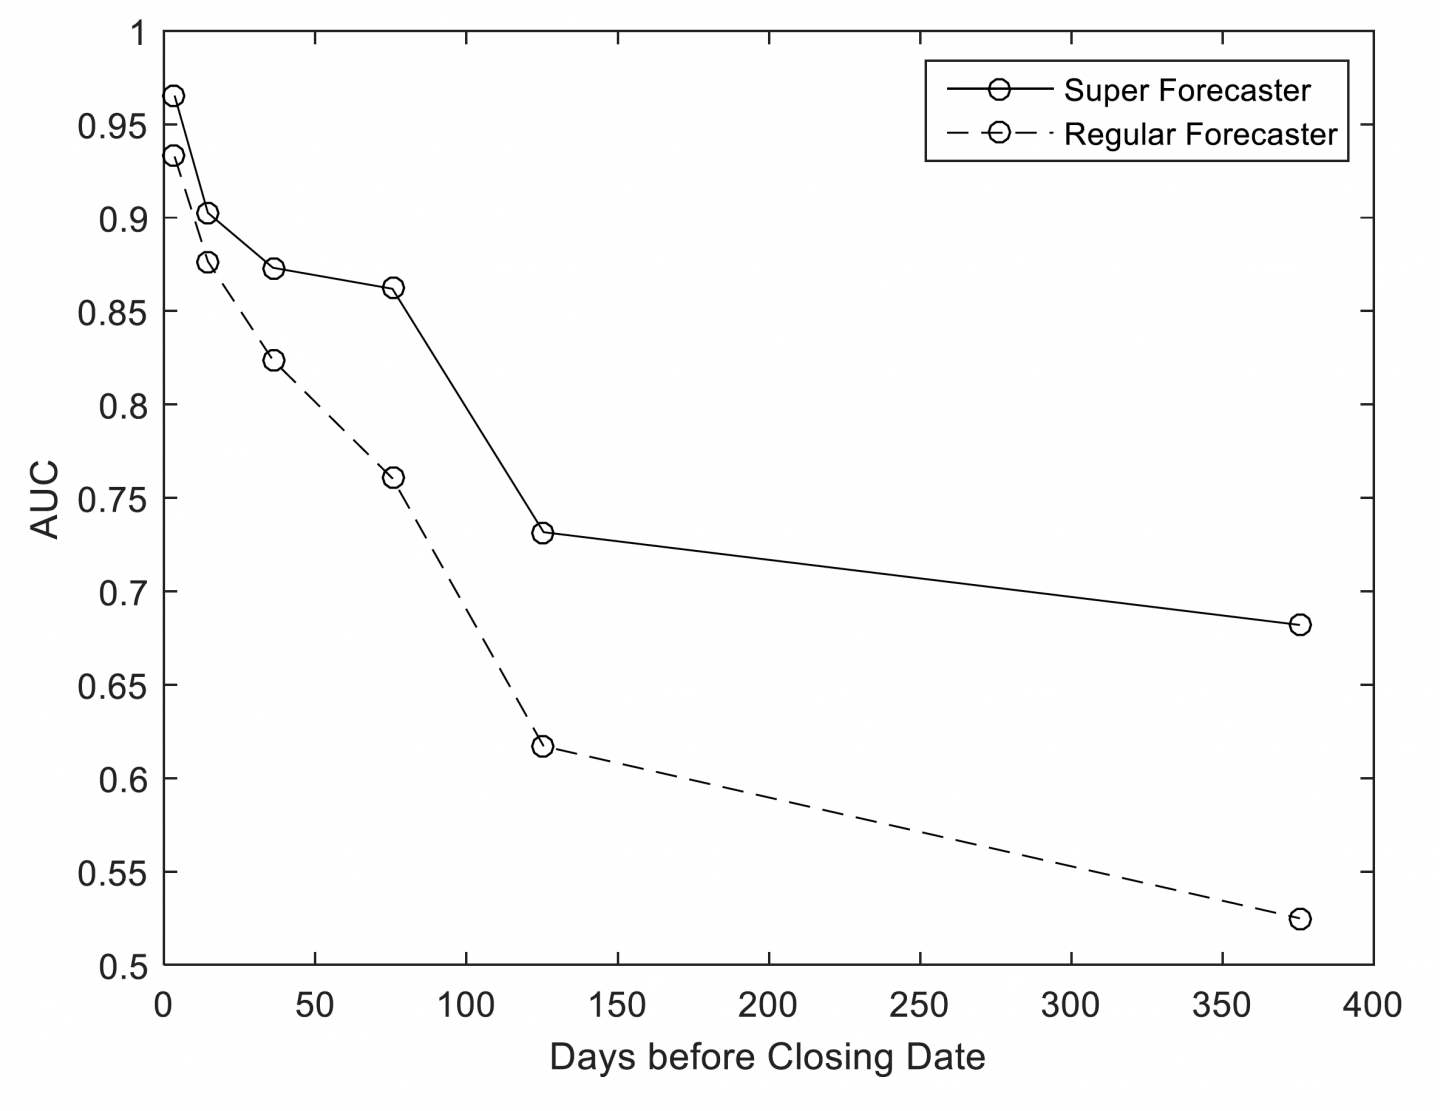
This chart uses an accuracy statistic known as AUC/ROC (see Steyvers et al. 2014) to represent the accuracy of binary, non-conditional forecasts, at different time horizons, throughout years 2-4 of GJP. Roughly speaking, this chart addresses the question: “At different forecasting horizons, how often (on average) were forecasters on ‘the right side of maybe’ (i.e. above 50% confidence in the binary option that turned out to be correct), where 0.5 represents ‘no better than chance’ and 1 represents ‘always on the right side of maybe’?”
For our purposes here, the key results shown above are, roughly speaking, that (1) regular forecasters did approximately no better than chance on this metric at ~375 days before each question closed, (2) superforecasters did substantially better than chance on this metric at ~375 days before each question closed, (3) both regular forecasters and superforecasters were almost always “on the right side of maybe” immediately before each question closed, and (4) superforecasters were roughly as accurate on this metric at ~125 days before each question closed as they were at ~375 days before each question closed.
If GJP had involved questions with substantially longer time horizons, how quickly would superforecaster accuracy declined with longer time horizons? We can’t know, but an extrapolation of the results above is at least compatible with an answer of “fairly slowly.”
I’d be interested to hear others’ thoughts on the general question, and any opinions on the linked piece.
I spent years trading in prediction markets so I can offer some perspective.
If you step back and think about it, the question ‘How well can the long-term future be forecasted?’ doesn’t really have an answer. The reason for this is that it completely depends on the domain of the forecasts. Like, consider all facts about the universe. Some facts are very, very predictable. In 10 years, I predict the Sun will exist with 99.99%+ probability. Some facts are very, very unpredictable. In 10 years, I have no clue whether the coin you flip will come up heads or tails. As a result, you cannot really say the future is predictable or not predictable. It depends on which aspect of the future you are predicting. And even if you say, ok sure it depends, but like what’s the average answer—even then, the only the way to arrive at some unbiased global sense of whether the future is predictable is to come up with some way of enumerating and weighing all possible facts about the future universe… which is an impossible problem. So we’re left with the unsatisfying truth that the future is neither predictable or unpredictable—it depends on which features of the future you are considering.
So when you show the plot above, you have to realize it doesn’t generalize very well to other domains. For example, if the questions were about certain things—e.g., will the sun exist in 10 years—it would look high and flat. If the questions were about fundamentally uncertain things—e.g., what will the coin flip be 10 years from now—it would look low and flat. The slope we observe in that plot is less a property of how well the future can be predicted and more a property of the limited set of questions that were asked. If the questions were about uncertain near-term geopolitical events, then that graph shows the rate that information came in to the market consensus. It doesn’t really tell us about the bigger picture of predicting the future.
Incidentally, this was my biggest gripe with Tetlock and Gardner’s Superforecasting book. They spent a lot of time talking about how Superforecasters could predict the future, but almost no time talking about how the questions were selected and how if you choose different sets of counterfactual questions you can get totally different results (e.g., experts cannot predict the future vs rando smart people can predict the future). I don’t really fault them for this, because it’s a slippery thorny issue to discuss. I hope I have given you some flavor of it here.
I agree with most of what you’re saying, but this part seems like giving up way too easily: “And even if you say, ok sure it depends, but like what’s the average answer—even then, the only the way to arrive at some unbiased global sense of whether the future is predictable is to come up with some way of enumerating and weighing all possible facts about the future universe… which is an impossible problem. So we’re left with the unsatisfying truth that the future is neither predictable or unpredictable—it depends on which features of the future you are considering.”
The only way to say something useful about this is literally enumerating all possible facts? Sounds needlessly pessimistic.
On the contrary, I think it could be tremendously interesting and useful to start building some kind of categorization of prediction domains that allows saying something about their respective predictability. Obviously this is a hard problem, obviously the universe is very complex and the categorization will miss a lot of the intricacy, but the same is true about many other domains of knowledge (probably, nearly all of them). Despite the complexity of the universe (i) we should keep looking for (extremely) simplified models that capture a lot of what we actually care about (ii) having even an extremely simplified model is often much better than no model at all (iii) the model will keep evolving over time (which is to say, it feels more like a potential new science than a single problem that can be stated and solved in a relatively short time frame).
Thanks for this. The work I really want to see from more forecasting projects is an analysis of how much things that typically impact people’s lives can be predicted. Things like health, home-ownership, relationships, career, etc. Specifically, people’s levels of cooperate/defect against their future self seems really inconsistent. i.e. people work really hard for their future selves along certain dimensions and then defect along lots of others. This is mostly just mimetic momentum, but still. Even rigorous research figuring out exactly what actuaries know that can be applied practically by people would be good. After all, actuaries have really good life outcomes along lots of dimensions, which means that most aren’t taking advantage of the insights there.
My hope had been that 80k hours would have evolved to do more in this area but they’ve specialized narrower than that AFAICT.
I’ve been thinking similar things about predictability recently. Different variables have different levels of predictability, it seems very clear. I’m also under the impression that the examples in the Superforecasting study were quite specific. It seems likely that similar problems to what they studied have essentially low predictability 5-10 years out (and that is interesting information!), but this has limited relevance on other possible interesting questions.
While I agree with the specifics, I don’t think that the answer to a question like, “What is the average predictability of all possible statements” would be all that interesting. We generally care about a very small subset of “all possible statements.” It seems pretty reasonable to me that we could learn about the predictability of the kinds of things we’re interested. That said, i feel like we can get most of the benefits of this by just having calibrated forecasters try predicting all of these things, and seeing what their resolution numbers are. So I don’t think we need to do a huge amount of work running tests for the sole purpose of better understanding long-term predictability.
I left some longer comments in the EA Forum Post discussion.
On both the piece and the question, I feel consistently confused that people keep asking “is long-range forecasting feasible” as a binary in an overly general context, which, as TedSanders mentioned, is trivially false in some cases and trivially true in others.
I get that if you are doing research on things, you’ll probably do research on real-world-esque cases. But if you were trying to prove long-term forecasting feasibility-at-all (which Luke’s post appears to, as it ends with sounding unsure about this point), you’d want to start from the easiest case for feasibility: the best superforecaster ever predicting the absolute easiest questions, over and over. This is narrow on forecasters and charitable on difficulty. I’m glad to see Tetlock et al looking at a narrower group of people this time, but you could go further. And I feel like people are still ignoring difficulty, to the detriment of everyone’s understanding.
If you predict coin tosses, you’re going to get a ROC AUC of .5. Chaos theory says some features have sensitive dependence to initial conditions that are at too low of resolution for us to track, and that we won’t be able to predict these. Other features are going to sit within basins of attraction that are easy to predict. The curve of AUC over time should absolutely drop off over time like that, because more features slip out of predictability as time goes on. This should not be surprising! The real question is “which questions are how predictable for which people?” (Evidently not the current questions for the current general forecasting pool.)
There are different things to do to answer that. Firstly, two things NOT to do that I see lots:
1. Implying low resolution/AUC is a fault without checking calibration (as I maybe wrongly perceive the above graph or post as doing, but have seen elsewhere in a similar context). If you have good calibration, then a .52 AUC can be fine if you say 50% to most questions and 90% to one question; if you don’t, that 90% is gonna be drowned out in a sea of other wrong 90%s
2. Trying to zero out questions that you give to predictors, e.g. “will Tesla produce more or less than [Tesla’s expected production] next year?”. If you’re looking for resolution/AUC, then baselining on a good guess specifically destroys your ability to measure that. (If you ask the best superforecaster to guess whether a series of 80% heads-weighted coin flips comes up with an average more than .8, they’ll have no resolution, but if you ask what the average will be from 0 to 1 then they’ll have high resolution.) It will also hamstring your ability to remove low-information answers if you try subtracting background, as mentioned in the next list.
Some positive options if you’re interested in figuring out what long-term questions are predictable by whom:
1. At the very least, ask questions you expect people to have real information about
2. Ask superforecasters to forecast metadata about questions, like whether people will have any resolution/AUC on subclasses of questions, or how much resolution/AUC differently ranked people will have on subclasses, or whether a prediction market would answer a question better (e.g. if there is narrowly-dispersed hidden information that is very strong). Then you could avoid asking questions that were expected to be unpredictable or wasteful in some other way.
3. Go through and trying to find simple features of predictable vs unpredictable long-term questions
4. Amplify the informational signal by reducing the haze of uncertainty not specific to the thing the question is interested in (mostly important for decade+ predictions). One option is to ask conditionals, e.g. “what percent chance is there that CRISPR-edited babies account for more than 10% of births if no legislation is passed banning the procedure” or something if you know legislation is very difficult to predict; another option is to ask about upstream features, like specifically whether legislation will be passed banning CRISPR. (Had another better idea here but fell asleep and forgot it)
5. Do a sort of anti-funnel plot or other baselining of the distribution over predictors’ predictions. This could look like subtracting the primary-fit beta distribution from the prediction histogram to see if there’s a secondary beta, or looking for higher-order moments or outliers of high credibility, or other signs of nonrandom prediction distribution that might generalize well. A good filter here is to not anchor them by saying “chances of more than X units” where X is already ~the aggregate mean, but instead make them rederive things (or to be insidious, provide a faulty anchor and subtract an empirical distribution from around that point). Other tweaked opportunities for baseline subtraction abound.
If Luke is primarily just interested in whether OpenPhil employees can make long-term forecasts on the kind of thing they forecast on, they shouldn’t be looking at resolution/AUC, just calibration, and making sure it’s still good at reasonably long timescales. To bootstrap, it would speed things along if they used their best forecasters to predict metadata—if there are classes of questions that are too unpredictable for them, I’m sure they can figure that out, especially if they spot-interviewed some people about long-term predictions they made.
The shape of the graph will depend a lot on what questions you ask. So it’s hard to interpret many aspects of the graph without seeing the questions that it’s based on (or at least a representative subset of questions).
In particular, my recollection is that some GJP questions took the form “Will [event] happen by [date]?”, where the market closed around the same time as the date that was asked about. These sorts of questions essentially become different questions as time passes—a year before the date they are asking if the event will happen in a one-year-wide future time window, but a month before the date they are instead asking if the event either will happen in a one-month-wide future time window or if it has already happened in an eleven-months-wide past time window. People can give more and more confident answers as the event draws closer because it’s easier to know if the event happened in the past than it is to know if the event will happen in the future, regardless of whether predicting the near future is easier than predicting the far future.
For example, consider the question “an earthquake of at least such-and-such magnitude will happen in such-and-such region between October 16 2019 and October 15 2020”. If you know that the propensity for such earthquakes is that they have a probability p of happening each day on average, and you have no information that allows you to make different guesses about different times, then the math on this question is pretty straightforward. Your initial estimate will be that there’s a (1-p)^365 chance of No Qualifying Earthquake. Each day that passes with no qualifying earthquake happening, you’ll increase the probability you put on No Qualifying Earthquake by reducing the exponent by 1 (“I know that an earthquake didn’t happen yesterday, so now how likely is to happen over the next 364 days?”, etc.). And if a qualifying earthquake ever does happen then you’ll change your prediction to a 100% chance of earthquake in that window (0% chance of No Qualifying Earthquake). You’re able to predict the near future (e.g. probability of an earthquake on October 17 2019) and the distant future (e.g. probability of an earthquake on October 14 2020) equally well, but with this [event] by [date] formulation of the question it’ll look like you’re able to correctly get more and more confident as the date grows closer.
John Maxwell makes a couple of good points in a comment about the linked post on the EA Forum:
Does anyone know of examples in the academic literature of “retrodictions” being used to assess forecasting accuracy?