Scott Winship argued recently that the ‘cost of thriving’ has fallen, pushing back once again against Oren Cass and his rather arbitrarily calculated ‘Cost of Thriving Index (COTI).’
Alex Tabarrok posted today on Marginal Revolution that Winship and coauthor Horpedahl were right, but that they face an uphill battle because people feel they are wrong, and suggested that our newly high time-value warps our perceptions. He points to Linder’s Theorem, which I hadn’t seen before, which states (correctly): “rising productivity decreases the demand for commodities whose consumption is expensive in time.”
Who is right, and why? If thriving is easier now, why does everyone think it isn’t?
Overview of the Disagreement
My analysis of the details shows that both perspectives are flawed.
Cass uses sloppy calculations, especially double counting employer-provided health insurance payments, and his calculations importantly exclude changes in taxation.
Winship and Horpedahl offer useful correctives to the sloppiness of the original Cass calculations in some places, and point out the rather glaring omission of taxation.
But they misunderstand the purpose of creating a Cost of Thriving Index. In several places, they therefore do the wrong calculation, confusing improved quality of goods with reduced cost of thriving.
COTI attempts to capture an important thing: Even if the quality of the standard ‘basket of goods’ is improved, that doesn’t change that there are huge pressures forcing people to buy whatever is the standard goods basket, and ‘improved quality’ is nice but fails to cancel this effect out. Winship does not seem to appreciate why that is an important thing to be measuring.
Excluding women and younger workers here is not arbitrary either. The whole idea is to ask what it takes for a typical man to support a typical family – you can’t simply decide to measure something else.
Let’s look at the proposed modifications, as argued in the Twitter thread.
Scott Winship: New from me and @jmhorp: “The Cost of Thriving Has Fallen: Correcting and Rejecting the American Compass Cost-of-Thriving Index”. Our critique of the @AmerCompass COTI developed by @oren_cass. Working paper version is up here.
Cass argues that there are not enough weeks in the year for the typical male worker to afford five basic “needs”, and that this “COTI” is up 22 weeks since 1985. We first work within his framework, improving his estimates and correcting a couple of clear errors.
Doing so gets the COTI for 2022 down to 42 weeks, up only 10 weeks from 1985. But we’re just getting started.
Cass assumes that when spending on, say, owning and operating a typical car rises by a certain amount, that this increase is entirely a “cost” increase. But of course, a *spending* increase can reflect people paying more for *better* stuff (rather than the same stuff).
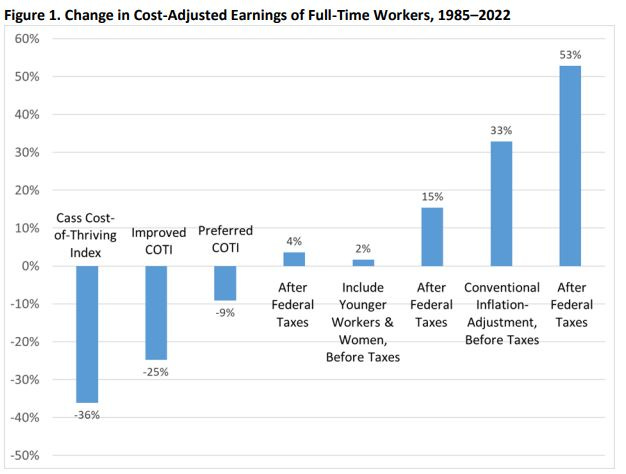
Digging into the price adjustments reveals how ad-hoc the original numbers were. It seems mostly correct to accept the new calculations in the Improved COTI, which represent a −25% adjustment, and then include the 13% adjustment for taxes, resulting in about a −13% adjustment. This still represents an increase in the cost of thriving.
Other adjustments reflect an instinct not to measure the thing to be measured.
Thriving in 2023 means consuming a legitimately far superior basket of goods than thriving required in 1985. This is true at least in food, transportation and health care. There are also other unmeasured areas with vast improvements, such as items associated with leisure and entertainment. There are also other areas, less anchored to physical good consumption, where typical quality of life got worse.
Those adjustments belong in our understanding of how things have changed, and whether 2023 is better than 1985. They have no place in the question being asked by the COTI. If I am socially or legally obligated to purchase more expensive but higher quality goods in order to thrive, I get to enjoy higher quality goods and I have to pay the additional cost. The Iron Law of Wages similarly talks of the cost needed to sustain a worker, not in a theoretically minimal fashion, but in a fashion that enables them to raise a family in practice.
We must then go step by step, for the five elements of the calculation.
Food
On food, Winship notes that the food basket being priced is only rarely adjusted in composition, and when that adjustment is made the cost at the time is held constant, so he undoes the basket adjustments in favor of an otherwise more precise deflator. This has a small effect in the direction of less price inflation.
What I notice is that this misses the point. Food quality and variety have dramatically improved since 1985 and much more so since 1955 – not enough to say ‘there is no great stagnation’ but people totally sell this change short.
That results in better human experience, it’s better to have better food, but it also puts pressure on households to purchase a higher quality basket. Winship attempts to compare groceries that ‘provide the same satisfaction’ but satisfaction is partly social. That’s largely the point of the COTI. For the purpose of measuring the true COTI, food costs have gone up more than either measure would suggest.
Transportation
On transportation, the same conceptual disagreement applies. Winship once again adjusts for a bunch of minor things in good ways, then asserts that one must consider the cost of transportation relative to the transportation benefits offered.
No! The whole point of the calculation is how much it costs to buy the transportation services necessary for thriving – if the quantity and quality of such services have increased, you don’t get to subtract that as a benefit. Also, if you are consuming more transportation, that is often a cost not a benefit, often a substitution in order to consume less house. If the higher consumption is more comfort and safety, that’s good but irrelevant.
Winship makes this explicit in the paper (bold mine):
This distinction points to a problem plaguing all of Cass’s nonfood estimates: Cass is looking at changes in spending, not changes in costs. Whereas the food budgets are defined with respect to a “need” standard that is presumed not to change over time (other than the price of affording it), Cass’s other “costs” simply look at what typical households spend.
Or in the Twitter thread:
The cost of the old stuff might actually decline, so increased spending isn’t necessarily an increased cost. Cars are obviously much nicer today than in 1985. We adjust for quality change using price indexes to translate the improved 2022 costs into 1985 dollars.
Yes! That’s exactly what Cass is doing. Tracking costs. It is good that my goods quality has increased, but that does not help my budget unless I can in practice get the old goods quality cheaper and still enjoy the old benefits. The new features on my 2022 car are irrelevant to how many weeks I must work to support my family, if my family demands those new features – whether or not those features provide real value. An academic saying ‘you could have instead purchased this other basket Y instead of basket X’ does not put food on my table or a car in my garage. What does is actually buying basket Y.
Or, from later in the thread:
We argue the policy priorities of American Compass (and to an extent, national conservatism generally) follow from a deeply flawed understanding of how living standards have changed. We hope US Senators will think twice before going down a doomerist road based on faulty numbers.
COTI attempts to measuring the ability of a worker to afford the standard of living they are expected to provide. The expected standard of living has gone up. This raises the amount of labor required to provide it.
It is a very real problem if people can’t meet the new higher standard. Many are choosing not to marry or have children because they see no path to providing what they see as the standard – the fact that they could provide a 1985-level standard on much less money does not mean they are thriving.
In many cases there is no access to 1985-quality goods at proportionally lower prices. One cannot buy 1985 health care, or 1985 education, or in many cases 1985 housing or transportation, and collect the discount. It would be fascinating to see how many people would choose to do so, if they could. They can’t.
Housing
On housing, Winship ignores the ‘only in Raleigh, NC’ measurement problem (which seems to slightly overstate overall cost increases, 583% there vs. 525% nationally) in favor of trying to shift from rental costs to ownership costs, since the majority of single earners own rather than rent, taking a weighted average. I would say that you have to weigh more heavily than this to renters, because what you care about it the marginal worker struggling to thrive.
Once again, Winship claims you have to take ‘services that should be measured as income’ into account here, which is irrelevant to the calculation.
He also wants to count home price appreciation, which is wrong. You don’t get to do that. Yes, in some sense it is income, but it does you no good unless you are willing to start owning less house, because you are functionally flat housing – if you sell you have to buy a new one. You can in theory tap the new home equity while not moving, but you have to finance that and people are wisely loathe to do this.
Meanwhile, while Winship acknowledges that buyers or renters face pure costs when home prices go up, he seems to exclude this. If you count home price appreciation as a benefit to owners because one could tap the equity, it is also a cost to renters over and above current rent costs, because they have incurred a future liability when attempting to become owners, although neither directly bears on the central question.
I like to think of this as: If you own as much house as you want to consume, you are synthetically flat housing. You should mostly be indifferent to changes in house prices. If you own less, you are short and should want prices lower. If you own more, you are long and should want them higher.
I do think that the adjustment not made here, the lower cost of financing on mortgages, would have been a real consideration, but it depends heavily on the exact start and end points, and it is no longer obvious that there is a clear long term trend, so it made sense to exclude it.
I am going to roughly let the extra housing adjustments and food adjustments cancel, since they are small and in opposite directions, and approximation is the goal.
Healthcare
On health care, it does seem like Winship is pointing out a large error where Cass double-counted the employer contribution to health insurance, counting it as a cost and also not counting it as income. That’s a big deal. So is failing to account for out-of-pocket expenses.
Winship’s solution addresses these issues, while raising the new one of not reflecting insurance costs for those who can’t get it from an employer. Not sure the right way to address that. Presumably most people on the margin of thriving are going to have a standard job. If they don’t, it’s going to be a huge nightmare.
Therefore, seems like for now the best solution is to accept the adjustment.
Education
On education, once again Winship gets to ‘thinking like an economist’ on amortizing costs in a situation where that mode of thinking does not apply, rather than looking at the actual constraints on families, which mostly don’t allow you to effectively pay for college after the fact.
The bigger difference is that Cass counts sticker prices on tuition, whereas Winship uses average price paid. Here Winship is right.
Winship then argues that college is an investment with strong returns that should be subtracted from costs, which is wrong in multiple ways here.
First, it doesn’t reflect the cost to thrive or the income constraints on households.
Second, if we consider college largely as a signaling cost and a zero-sum competition, in terms of costs and investments, you don’t count ‘not losing the Red Queen’s Race’ as a benefit when calculating household finances, any more than you get to count ‘don’t get thrown in jail for not paying taxes’ as a benefit for paying your taxes.
Third, this would be double counting. Increases in income are already factored in.
Taxes
On taxes, Winship is flat out correct here:
One cost of thriving that the index does not consider is taxation. Failing to include the net impact of taxes is a major omission, especially because of how much this component has changed between 1985 and 2022. In broad terms, families with children have seen large reductions in their federal income tax burden, largely due to the introduction and expansion of the child tax credit. The absence of taxes in COTI is notable since expanding tax credits to working families is a signature policy proposal from American Compass.
…
The family in 1985 will owe $2,158 in federal income taxes, or about 9 percent of their market income.
…
In 2022, the tax situation of the family had changed dramatically. A family did not owe federal income tax but received a net tax credit of about $646.
Looking only at pre-tax income, without taxes and transfers, is Obvious Nonsense that leads to many misconceptions and false claims, especially when people compare the USA to various European countries. You can’t simply not make this adjustment.
The numbers above seem to exclude payroll taxes, the 2022 family isn’t actually facing a negative tax rate. I am not checking the numbers here. I am also confused why federal taxes appear three times in the adjustment chart, unless they’re being continuously undone and redone, which is a really bizarre way to present data.
Synthesis
Where does that leave us overall?
If we want to measure the COTI, as per its original justification, it seems correct to more or less accept the ‘improved COTI’ of −25% instead of −36%, reflecting the errors in health care premiums and college sticker versus effective prices, and various minor fixes. We then must take taxes into account, which should leave us with about a −13% change from 1985 to 2023.
If we want to measure the total quality of the basket of goods consumed, we can observe the full 53% increase noted by Winship.
Thus, we can (very roughly) estimate a 75% increase in the quality of goods required in order to thrive, in order to make both these calculations true at once. This varies greatly by area.
If I am consuming 53% more goods, but comparing myself to a 75% higher standard, am I better off? Does it matter if some elements of the old goods basket are unavailable in their old forms, and now seem out of reach in their new forms? What good does it do us to have better goods, if we do not have felt economic permission to start families?
Those are excellent questions.
Then the research has more limited generalizability properties, and I do think this is going to bias it to a no answer.
The correction for this changed the result by −2% (made 2023 look slightly worse). If you trust their calculation there (I didn’t check) it happens not to change the answer enough to matter.
EDIT: I think Whitakk is plausibly right here, doesn’t impact the OP since I excluded the adjustment (and any adjustments on top of it) either way, not going to go verify in detail. Makes it even more stark that all the adjustments are in the same direction.
I don’t think that’s right (the chart is really misleading—you have to look at bars 3 and 4 as a group, then 5 and 6 as a separate group, then 7 and 8 as a separate group).
Table 1 in the paper shows the “over-25-male” version: −9% before taxes (row 9), +4% after taxes (row 14)
Table 2 in the paper shows the same for all workers: +2% before taxes (row 9), +15% after taxes (row 14)
So, a +11pp impact (not −2 as the chart seems to show).
(Of course, if you’re giving credit for increased female earnings, you also probably have to count childcare on the cost side too. If I’m reading Table 3 correctly this won’t make a big difference in aggregate, because although the nursery-plus school category has had a high cost increase it’s still a very small share of the pie.)
is COTI actually an inverted measure of the literal “cost of thriving”? i.e. the index goes up when the cost goes down? otherwise, this apparent inverted sign (a −13% change in COTI representing an “increase in the cost of thriving”) is throwing me for a loop.
here it happens again: tax costs have decreased since 1985, but somehow that manifests as an increase to the “cost of thriving” index (-25% —> −13%).
Yeah, it’s inverted versus what the name implies, it’s amount of thriving you can get per hour of work.
Something that seems to be omitted from all this are the additional costs that individuals now “have to” include in monthly expenses that didn’t exist in 1985: internet, cellphones, subscriptions, etc. Not to mention the fact that in order to spend money in 1985 one had to get in their underwhelming car, drive to the store, and look for an item. Now we’re blasted with ads everywhere and merely need to reach into our pockets and swipe a few times to spend our money.