Compute Trends — Comparison to OpenAI’s AI and Compute
This is a slightly modified version of Appendix E from our paper “Compute Trends Across Three Eras of Machine Learning”. You can find the summary here and the complete paper here.
After sharing our updated compute trends analysis a common question was: “So how are your findings different from OpenAI’s previous compute analysis by Amodei and Hernandez?”. We try to answer this question in this short post.
Comparison to OpenAI’s AI and Compute
OpenAI’s analysis shows a 3.4 month doubling from 2012 to 2018. Our analysis suggests a 5.7 month doubling time from 2012 to 2022 (Table 1, purple). In this post, we investigate this difference. We use the same methods for estimating compute for the final training run. Our methods are described in detail in Estimating training compute of Deep Learning models.
Our analysis differs in three points: (I) number of samples, (II) extended time period, and (III) the identification of a distinct large-scale trend. Of these, either the time period or the separation of the large-scale models is enough to explain the difference between our results.
To show this, we investigate the same period as in the OpenAI dataset. The period starts with AlexNet in September 2012 and ends with AlphaZero in December 2018.
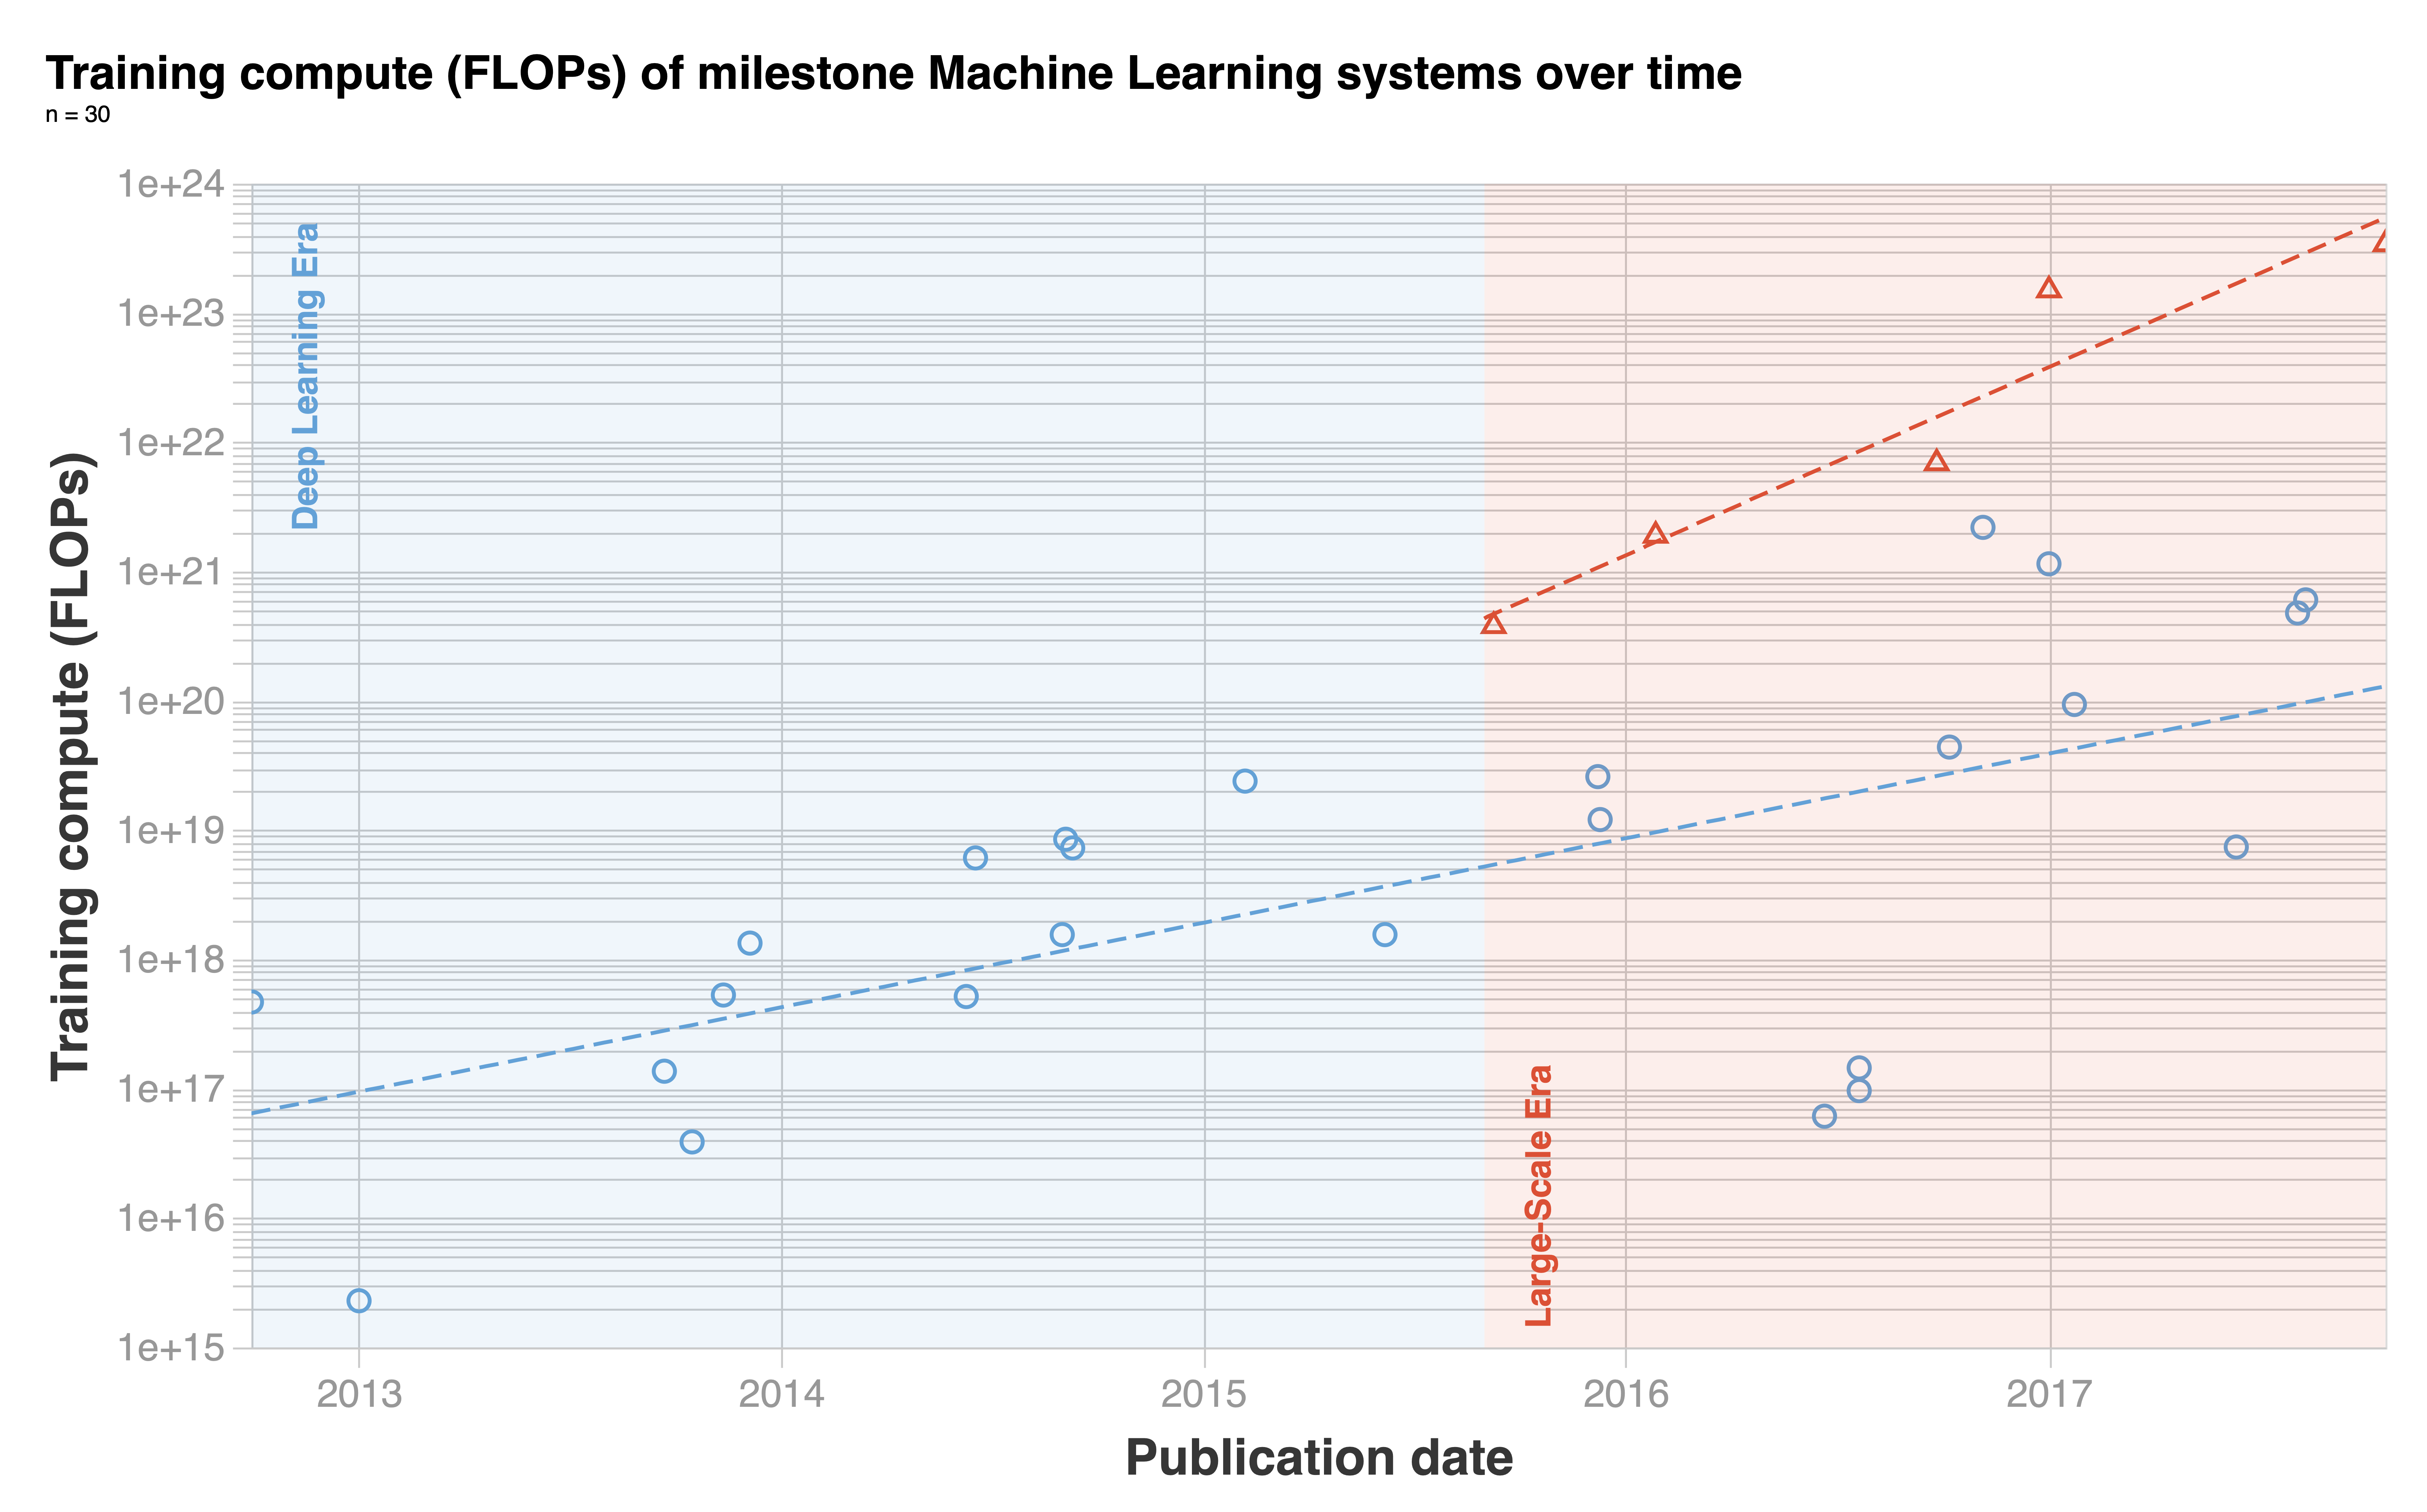
As discussed, our work suggests that between 2015 and 2017 a new trend emerged — the Large-Scale Era. We discuss two scenarios: (1) assuming our distinction into two trends and (2) assuming there is a single trend (similar to OpenAI’s analysis).
Period | Data | Scale (FLOPs) | Slope | Doubling time | R² |
|---|---|---|---|---|---|
AlexNet to AlphaZero 09-2012 to 12-2017 | All models (n=31) | 1e+16 / 1e+21 | 1.0 OOMs/year [0.6 ; 1.0 ; 1.3] | 3.7 months [2.8 ; 3.7 ; 6.2] | 0.48 |
Regular scale (n=24) | 2e+16 / 1e+20 | 0.8 OOMs/year [0.5 ; 0.8 ; 1.1] | 4.5 months [3.2 ; 4.3 ; 7.8] | 0.48 | |
AlphaGo Fan to AlphaZero 09-2015 to 12-2017 | Large scale (n=7) | 2e+17 / 3e+23 | 1.2 OOMs/year [1.0 ; 1.3 ; 1.8] | 3.0 months [2.1 ; 2.9 ; 3.5] | 0.95 |
AlphaZero to present 12-2017 to 02-2022 | All models (n=62) | 5e+19 / 1e+23 | 0.8 OOMs/year [0.5 ; 0.8 ; 1.1] | 4.5 months [3.3 ; 4.4 ; 7.1] | 0.36 |
Regular scale (n=47) | 2e+19 / 3e+22 | 0.9 OOMs/year [0.6 ; 0.9 ; 1.2] | 4.2 months [3.1 ; 4.2 ; 6.0] | 0.46 | |
Large scale (n=15) | 1e+22 / 6e+23 | 0.4 OOMs/year [0.3 ; 0.4 ; 0.7] | 8.7 months [5.4 ; 8.7 ; 14.6] | 0.68 | |
AlexNet to present 09-2012 to 02-2022 | All models (n=93) | 8e+16 / 7e+22 | 0.6 OOMs/year [0.5 ; 0.6 ; 0.7] | 5.7 months [4.9 ; 5.7 ; 6.8] | 0.60 |
Regular scale (n=72) | 4e+16 / 2e+22 | 0.6 OOMs/year [0.5 ; 0.6 ; 0.7] | 5.7 months [5.0 ; 5.7 ; 6.8] | 0.69 | |
AlphaGo Fan to present 12-2017 to 02-2022 | Large scale (n=19) | 4e+21 / 6e+23 | 0.3 OOMs/year [0.1 ; 0.3 ; 0.5] | 10.7 months [7.8 ; 10.7 ; 27.2] | 0.66 |
Table 1: Trendline data over the same period as OpenAI’s analysis, partitioned around the release of three landmark models: AlexNet, AlphaGo Fan, and AlphaZero.
We can interpret these results in two ways:
There is a single trend, which showed a 3.7 month doubling time between September 2012 and December 2017 (Table 1, red). Afterward, the trend slowed down to a 4.5 month doubling time (Table 1, yellow).
A new trend of large-scale models split off the main trend in late 2015. If we separate the large-scale models, we can see that the regular-scale trend had a similar doubling time before and after 2017 (4.5 and 4.2 months; Table 1, green and blue). OpenAI’s result is different from ours because they are mixing the regular-scale and large-scale trends.
In the first interpretation, our result is different from OpenAI as we are grouping together the pre-2017 and post-2017 trends into a single analysis.
In the second interpretation, our result is different because we are analyzing the trend in large-scale and regular-scale models differently.
We currently favor the second explanation. This is because (a) the large-scale trend story seems to better predict developments after 2017, while Lyzhov found that the single-trend story does not extend past 2017, and (b) we think that the models in the large-scale trend are explained by a drastic departure in funding (see Appendix F for a discussion if large-scale models are a different category and various caveats of this interpretation).
It looks like the AlphaGo models play a huge role in the “trend” of large-scale models.
In your spreadsheet, AlphaGo Master (January 2017) was much larger than anything that came before it (22x the training compute). AlphaGo Zero doubled that later the same year (October 2017) and remained the largest model by training compute for almost 4 years, until August 2021. By late 2021 the trend had caught up and now 5 models have exceeded AlphaGo Zero, all language models, led by Megatron-Turing NLG 530B (October 2021) which has 4x the training compute.
The trend looked steeper when AlphaGo Master & Zero were near the end of the trend line, when OpenAI was analyzing it in 2018. The trend for the “large-scale era” looks shallower now that those models are in the first half of the era. To me it looks like those models are off-trend, even compared to other “large scale” models. DeepMind was much more willing to throw compute at the AlphaGo models than anyone has been with any other model.
Thanks for the comment!
I am personally sympathetic to the view that AlphaGo Master and AlphaGo Zero are off-trend.
In the regression with all models the inclusion does not change the median slope, but drastically increases noise, as you can see for yourself in the visualization selecting the option ‘big_alphago_action = remove’ (see table below for a comparison of regressing the large model trend without vs with the big AlphaGo models).
In appendix B we study the effects of removing AlphaGo Zero and AlphaGo Master when studying record-setting models. The upper bound of the slope is affected dramatically, and the R2 fit is much better when we exclude them, see table 6 reproduced below.
Thanks for the comment! That sounds like a good and fair analysis/explanation to me.