Super-Exponential versus Exponential Growth in Compute Price-Performance
In recent months and years I have seen sober analyses of compute price-performance suggesting that the price-performance in computing (that is, the amount of calculations per second that you can buy for a dollar) has a doubling time of something like 2-3 years. I do not think these figures are good predictors of future expectations, and I wish to explain why.
Over the years I have often returned to Kurzweil’s[1] plot of price-performance in the 20th century. I occasionally update the plot on my own and marvel that the trend has persisted essentially unabated since it was published, illustrating a continuous and consistent trend from 1900 through 2023. For your reference and for the sake of clarity I have taken the original plot and added one recent point, the AMD RX 7600 GPU, which boasts 21.4 TFLOP/s (single-precision) at a price point of $269.99 as of this week. Take my word for it that the plots between 1995 and 2023 remain essentially on-trend.
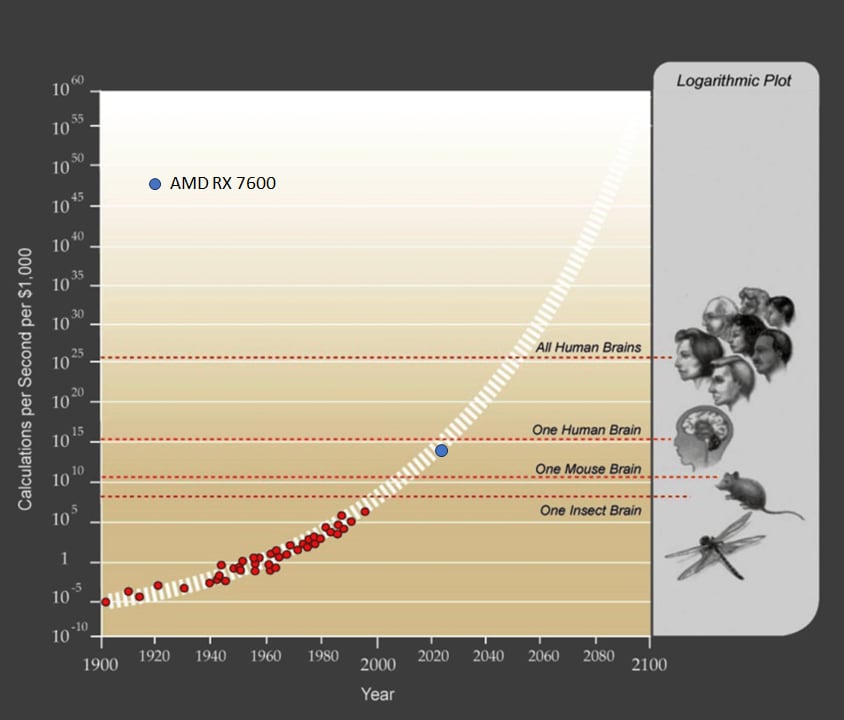
This plot[2] has no “doubling time” because it is super-exponential, i.e. there is an exponent inside the exponent, and the effective doubling time gets shorter over time. I have not found any published reference to how the white dashed band is calculated, but my own best fit line is:
where C is price-performance of compute in FLOP/s per $1000 and t in this case is years-since-1900. The instantaneous doubling time for this trend as of today would be about 0.93 years, less than half of even the most Pollyannaish of the recent forecasts. And the instantaneous doubling time obviously gets shorter each year.
The discrepancy between this <1 year doubling time and the >2 year doubling time observed in more recent publications is explained by the fact that trends calculated on the basis of narrow, recent time-frames will only capture one paradigm, e.g. the “GPU paradigm”, which, like all individual paradigms in technology, exhibits S-curve behavior, starting out slow, accelerating, and then flattening. I also note that serious authors tend to present doubling-time figures that lean in the pessimistic direction.
Of course, it is entirely possible that 2023 marks the end of the validity of the above super-exponential trend. Perhaps, for some reason, no new computing paradigm arises to put us back on the white dashed band.
I feel it is important to consider that predictions for the end of the decade are wildly different depending on whether we extrapolate using this super-exponential trend or a “merely” exponential trend. Using an exponential extrapolation from today, we would expect compute to be roughly 10x cheaper per FLOP/s by 2030. Using the super-exponential extrapolation projects something closer to 1000x improvement in price-performance. Take these numbers as rough, since the extrapolations depend very much on the minutiae of how you do your curve fit. Regardless of the details, it is a difference of orders of magnitude.
I don’t know how exactly we could achieve 1000x price-performance in 7 years, but responsible forecasting requires that we be open to the possibility of unforeseeable paradigm shifts, and I wouldn’t want to bet against a curve that has held up for 123 years. If you had tried to make forecasts over the timescale of a decade using an exponential trend at any point over the last 100 years, you would have been consistently wrong by a margin that only increases with each decade. It seems particularly important that we avoid being wrong this decade.
Discussion in the comments prompted me to add this table of data to the original post, so that it would be more visible and provide a shared frame of reference:
| Hardware | Precision | TFLOPS | Price ($) | FLOPS/$1000 |
| Nvidia GeForce RTX 4090 | FP8 | 82.58 | $1,600 | 5.16E+13 |
| AMD RX 7600 | FP8 | 21.5 | $270 | 7.96E+13 |
| TPU v5e | INT8 | 393 | $4730* | 8.31E+13 |
| H100 | FP16 | 1979 | $30,603 | 6.47E+13 |
| H100 | FP8 | 3958 | $30,603 | 1.29E+14 |
*The price point of the TPU v5e is estimated based on a variety of sources, and adjusted based on my calculations from the hourly usage rates.
- ^
I can’t figure out if Kurzweil was the one to originally publish this plot, but I know that the first place I saw it was in The Singularity is Near in 2005.
- ^
For reference, the “one human brain” estimate comes from FLOPS = 86 billion neurons×1000 synapses/neuron×200 Hz = 10^16 − 10^17 FLOPSa mode of estimation that I suspect Kurzweil would admit is tendentious.
This post (and the author’s comments) don’t seem to be getting a great response and I’m confused why? The post seems pretty reasonable and the author’s comments are well informed.
My read of the main thrust is “don’t concentrate on a specific paradigm and instead look at this trend that has held for over 100 years”.
Can someone concisely explain why they think this is misguided? Is it just concerns over the validity of fitting parameters for a super-exponential model?
(I would also add that on priors when people claim “There is no way we can improve FLOPs/$ because of reasons XYZ” they have historically always been wrong.)
A double exponential model seems very questionable. Is there any theoretical reason why you chose to fit your model with a double exponential? When fitting your model using a double exponential, did you take into consideration fundamental limits of computation? One cannot engineer transistors to be smaller than atoms, and we are approaching the limit to the size of transistors, so one should not expect very much of an increase in the performance of computational hardware. We can add more transistors to a chip by stacking layers (I don’t know how this would be manufactured, but 3D space has a lot of room), but the important thing is efficiency, and one cannot make the transistors more efficient by stacking more layers. With more layers in 3D chips, most transistors will just be off most of the time, so 3D chips provide a limited improvement.
Landauer’s principle states that to delete a bit of information in computing, one must spend at least k⋅T⋅ln(2) energy where k is Boltzmann’s constant, T is the temperature, and ln(2)=0.693…. Here,k≈1.38⋅10−23J/K (Joules per Kelvin) which is not a lot of energy at room temperature. As the energy efficiency of computation approaches Landauer’s limit, one runs into problems such as thermal noise. Realistically, one should expect to spend more than 100kT energy per bit deletion in order to overcome thermal noise (and this is ). If one tries to avoid Landauer’s limit using reversible computation, then the process of computation becomes more complicated, so with reversible computation, one trades energy efficiency per bit operation with the number of operations computed, and the amount of space one uses in performing that computation. The progress in computational hardware capabilities will slow down as one progresses from classical computation to reversible computation. There are also ways of cutting the energy efficiency of deletion of information from 100kT per bit to something much closer to kTln(2), but they seem like a complicated engineering challenge.
The Margolus-Levitin theorem states that it takes h4E energy to go from a quantum state to an orthogonal quantum state (by flipping a bit, one transforms a state into an orthogonal state) where h is Planck’s constant (h≈6.626⋅10−34J⋅S (Joules times seconds)) and E is the energy. There are other fundamental limits to the capabilities of computation.
As I remarked in other comments on this post, this is a plot of price-performance. The denominator is price, which can become cheap very fast. Potentially, as the demand for AI inference ramps up over the coming decade, the price of chips falls fast enough to drive this curve without chip speed growing nearly as fast. It is primarily an economic argument, not a purely technological argument.
For the purposes of forecasting, and understanding what the coming decade will look like, I think we care more about price-performance than raw chip speed. This is particularly true in a regime where both training and inference of large models benefit from massive parallelism. This means you can scale by buying new chips, and from a business or consumer perspective you benefit if those chips get cheaper and/or if they get faster at the same price.
Roodman’s hyperexponential model of GDP growth is both a better fit to a larger dataset and backed by plausible economics. The case for hyperexponential in Moore’s law is weaker on the data and constrained by rapidly approaching physical limits of miniaturization . (Although a GDP singularity may imply/require a similar trend in Moore’s law eventually, there’s also room to grow for a bit just by scaling out)
Does Roodman’s model concern price-performance or raw performance improvement? I can’t find the reference and figured you might know. In either case, price-performance only depends on Moore’s law-like considerations in the numerator, while the denominator (price) is a a function of economics, which is going to change very rapidly as returns to capital spent on chips used for AI begins to grow.
It’s a GDP model, so its more general than any specific tech, as GDP growth subsumes all tech progress.
Main article
LW linkpost
I think that this is almost certainly an overestimate, in that the 200 Hz rate I don’t think accounts for the full compute cycle to which a synapse is relevant. I think it makes more sense to either consider effective synapse compute cycles at something closer to < 10 Hz or consider the compute units at scales of groups of synapses on dendritic branches or even whole neurons. Perhaps both. Either way, you should trim at least 1 OOM off that number for that.
I suspect this is because Each time a new paradigm ends up overtaking the previous one it is usually a paradigm that had serious flaws in the past and was dismissed as being impractical then. But when the scramble for a new way to compute comes around People re-examine these old technologies. And someone realizes that with new material science something has become Financially and technically. possible. This means that by necessity the next step is going to be something that people consider fringe at the moment.
Off the top of my head, I can think of at least 3 new paradigms that would be entirely new basis of thinking about computing.
Optical quantum computers using time crystals as a memory system.
Analog Nano computers using Mannites that can act as both computation and memory storage in a single unit by using literal analog shape.
spintronics Which is probably the one I bet on. Because it uses a lot of the same manufacturing processes. So we used today, but instead of having a stream of electrons representing one and the absence of those electrons representing zero, the spin of each particle is the flip. So each circuit is actually a single atom. That is either spin up or spin down.
Would you say we are limited by GPU RAM instead? I don’t see that growing as fast.
A couple of things:
TPUs are already effectively leaping above the GPU trend in price-performance. It is difficult to find an exact cost for a TPU because they are not sold retail, but my own low-confidence estimates for the price of a TPU v5e place its price-performance significantly above the GPU given in the plot. I would expect that the front runner in price-performance cease to be what we think of as GPUs and thus intrinsic architectural limitations of GPUs cease to be the critical bottleneck.
Expecting price-performance to improve doesn’t mean we necessarily expect hardware to improve, just that we become more efficient at making hardware. Economies of scale and refinements in manufacturing technology can dramatically improve price-performance by reducing manufacturing costs, without any improvement in the underlying hardware. Of course, in reality we expect both the hardware to become faster and the price of manufacturing it to fall. This is even more true as the sheer quantity of money being poured into compute manufacturing goes parabolic.
Lol what? Nvidias stock price says otherwise (as does a deep understanding of the hardware)
Could you lay that out for me, a little bit more politely? I’m curious.
Nvidia’s stock price and domination of the AI compute market is evidence against your strong claim that “TPUs are already effectively leaping above the GPU trend”. As is the fact that Google Cloud is—from what I can tell—still more successful renting out nvidia gpus than TPUs, and still trying to buy H100 in bulk.
There isn’t alot of info yet on TPU v5e and zero independent benchmarks to justify such a strong claim (Nvidia dominates MLPerf benchmarks).
Google’s own statements on TPU v5e also contradict the claim:
It apparently doesn’t have FP8, and the INT8 perf is less than peak throughput FP8 of a RTX 4090, which only costs $1,500 (and is the current champion in flops per dollar). The H100 has petaflops of FP8/INT8 perf per chip.
From my notes. Your statement about RTX 4090 leading the pack in flops per dollar does not seem correct based on these sources, perhaps you have a better source for your numbers than I do.
I did not realize that H100 had >3.9 PFLOPS at 8-bit precision until you prompted me to look, so I appreciate that nudge. That does put the H100 above the TPU v5e in terms of FLOPS/$. Prior to that addition, you can see why I said TPU v5e was taking the lead. Note that the sticker price for TPU v5e is estimated, partly from a variety of sources, partly from my own estimate calculated from the lock-in hourly usage rates.
Note that FP8 and INT8 are both 8-bit computations and are in a certain sense comparable if not necessarily equivalent.
There are many different types of “TFLOPS” that are not directly comparable, independent of precision. The TPU v5e does not have anything remotely close to 393 TFLOPs of general purpose ALU performance. The number you are quoting is the max perf of its dedicated matmul ALU ASIC units, which are most comparable to nvidia tensorcores, but worse as they are less flexible (much larger block volumes).
The RTX 4090 has ~82 TFLOPs of general purpose SIMD 32⁄16 bit flops—considerably more than the 51 or 67 TFLOPs of even the H100. I’m not sure what the general ALU flops of the TPU are, but it’s almost certainly much less than the H100 and therefore less than the 4090.
The 4090′s theoretical tensorcore perf is 330⁄661 for fp16[1] and 661/1321[2][3] for fp8 dense/sparse (sparse using nvidia’s 2:1 local block sparsity encoding), and 661 int8 TOPs (which isn’t as useful as fp8 of course). You seem to be using the sparse 2:1 fp8 tensorcore or possibly even 4bit pathway perf for H100, so that is most comparable. So if you are going to use INT8 precision for the TPU, well the 4090 has double that with 660 8-bit integer TOPS for about 1/4th the price. The 4090 has about an OOM lead in low precision flops/$ (in theory).
Of course what actually matters is practical real world benchmark perf due to the complex interactions between RAM and cache quantity, various types of bandwidths (on-chip across various caches, off-chip to RAM, between chips etc) and so on, and nvidia dominates in most real world benchmarks.
wikipedia
toms hardware
nvidia ada gpu arch
Thanks for the interesting and thoughtful article. As a current AI researcher and former silicon chip designer, I’d suspect that our perf-per-doller is trending a bit slower than exponential now and not a hyperexponential. My first datapoint in support of this is the data from https://en.wikipedia.org/wiki/FLOPS which shows over 100X perf/dollar improvement from 1997 to 2003 (6 years), but the 100X improvement from 2003 is in 2012 (9 years), and our most recent 100X improvement (to the AMD RX 7600 the author cites) took 11 years. This aligns with TOP500 compute performance, which is progressing at a slower exponential since about 2013: https://www.nextplatform.com/2023/11/13/top500-supercomputers-who-gets-the-most-out-of-peak-performance/ . I think that a real challenge to the future scaling is the size of the silicon atom relative to current (marketing-skewed) process nodes supported by TSMC, Intel, and others. I don’t think our silicon performance will flatline in the 2030′s as implied by https://epochai.org/blog/predicting-gpu-performance , but it could be that scaling FET-based geometries becomes very difficult and we’ll need to move away from the basic FET-based design style used for last 50 years to some new substrate, which will slow the exponential for a bit. That said, I think that even if we don’t get full AGI by 2030, the AI we do have by 2030 will be making real contributions to silicon design and that could be what keeps us from dipping too much below an exponential. But my bet would be against a hyperexponential playing out over the next 10 years.
Current Nvidia GPU prices are highly distorted by scarcity, with profit margins that are reportedly in the 80-90% of sale price range: https://www.tomshardware.com/news/nvidia-makes-1000-profit-on-h100-gpus-report
If these were commodified to the point that scarcity didn’t influence price then that $/flop point would seemingly leap up by an order of magnitude to above 1e15Flop/$1000 scraping the top of that curve, ie near brain equivalence computation power in $3.5k manufactured hardware cost, and latest Blackwell GPU has lifted that performance by another 2.5x with little extra manufacturing cost. Humans as useful economic contributors are so screwed, even with successful alignment the socioeconomic implications are beyond cataclysmic.
The Tom’s Hardware article is interesting, thanks. It makes the point that the price quoted may not include the full ‘cost of revenue’ for the product in that it might be the bare die price and not the tested and packaged part (yields from fabs aren’t 100% so extensive functional testing of every part adds cost). The article also notes that R&D costs aren’t included in that figure; the R&D for NVIDIA (and TSMC, Intel, AMD, etc) are what keep that exponential perf-per-dollar moving along.
For my own curiosity, I looked into current and past income statements for companies. Today, NVIDIA’s latest balance sheet for the fiscal year ending 1/31/2024 has $61B in revenue, 17B for cost of revenue (that would include the die cost, as well as testing and packaging), R&D of 9B, and a total operating income of 33B. AMD for their fiscal year ending 12/31/2023 had $23B revenue, 12B cost of revenue, 6B R&D, and 0.4B operating income. Certainly NVIDIA is making more profit, but the original author and wikipedia picked the AMD RX 7600 as the 2023 price-performance leader and there isn’t much room in AMD’s income statement to lower those prices. While NVIDIA could cut their revenue in half and still make a profit in 2023, in 2022 their profit was 4B on 27B in revenue. FWIW, Goodyear Tire, selected by me ‘randomly’ as an example of a company making a product with lower technology innovation year-to-year, had 20B revenue for the most recent year, 17B cost of revenue, and no R&D expense. So if we someday plateau silicon technology (even if ASI can help us build transistors smaller than atoms, the plank length is out there at some point), then maybe silicon companies will start cutting costs down to bare manufacturing costs. As a last study, the wikipedia page on FLOPS cited the Pentium Pro from Intel as part of the 1997 perf-per-dollar system. For 1997, Intel reported 25B in revenues, 10B cost of sales (die, testing, packaging, etc), 2B in R&D, and an operating income of 10B; so it was spending a decent amount on R&D too in order to stay on the Moore’s law curve.
I agree with Foyle’s point that even with successful AGI alignment the socioeconomic implications are huge, but that’s a discussion for another day...
I think it is also good to consider that it’s the good-but-not-great hardware that has the best price-performance at any given point in time. The newest and best chips will always have a price premium. The chips one generation ago will be comparatively much cheaper per unit of performance. This has been generally true since I’ve started recording this kind of information.
As I think I mentioned in another comment, I didn’t mention Moore’s law at all because it has relatively little to do with the price-performance trend. It certainly is easy to end up with a superexponential trend when you have an (economic) exponential trend inside a (technological) exponential trend, but as other commenters point out, the economic term itself is probably superexponential, meaning we shouldn’t be surprised to see price-performance to fall more quickly than exponential even without exponential progress in chip speed.
I’m extremely confused how extrapolating out the curve can possibly get you 1000x improvement in FLOP/$ within 7 years.
What happens if you backtest this autoregressive model?
Can you show the plot for this fit? (I can’t seem to see the image in this post, maybe that contains the fit?)
Lesswrong seems to be having some image troubles, but the image is clear on the GreaterWrong mirror
The graph was showing up fine before, but seems to be missing now. Perhaps it will come back. The equation is simply an eyeballed curve fit to Kurzweil’s own curve. I tried pretty hard to convey that the 1000x number is approximate:
> Using the super-exponential extrapolation projects something closer to 1000x improvement in price-performance. Take these numbers as rough, since the extrapolations depend very much on the minutiae of how you do your curve fit. Regardless of the details, it is a difference of orders of magnitude.
The justification for putting the 1000x number in the post instead of precisely calculating a number from the curve fit is that the actual trend is pretty wobbly over the years, and my aim here is not to pretend at precision. If you just look at the plot, it looks like we should expect “about 3 orders of magnitude” which really is the limit of the precision level that I would be comfortable with stating. I would guess not lower than two orders of magnitude. Certainly not as low as one order of magnitude, as would be implied by the exponential extrapolation, and would require that we don’t have any breakthroughs or new paradigms at all.
I just fixed it. Looks like it was a linked image to some image host that noped out when the image got more traffic. I moved it to the LessWrong image servers. (To avoid this happening in the future, download the image, then upload it to our editor. Copy-pasting text that includes images creates image blocks that are remotely hosted).
Thanks, I’ll keep that in mind!