Rick Korzekwa, March 3, 2023
A major theme in reporting on ChatGPT is the rapid growth of its user base. A commonly stated claim is that it broke records, with over 1 million users in less than a week and 100 million users in less than two months. It seems not to have broken the record, though I do think ChatGPT’s growth is an outlier.
Checking the claims
ChatGPT growth
From what I can tell, the only source for the claim that ChatGPT had 1 million users in less than a week comes from this tweet by Sam Altman, the CEO of OpenAI:
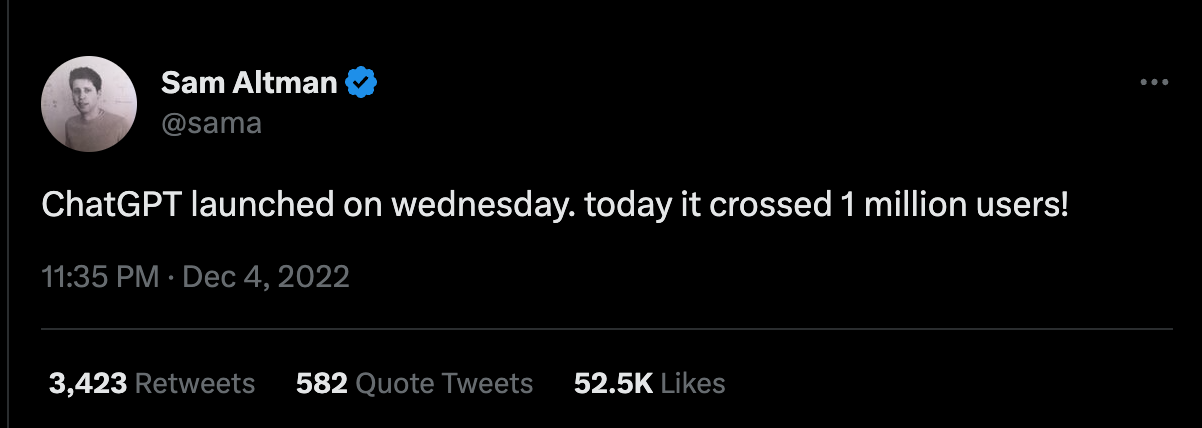
I don’t see any reason to strongly doubt this is accurate, but keep in mind it is an imprecise statement from a single person with an incentive to promote a product, so it could be wrong or misleading.
The claim that it reached 100 million users within two months has been reported by many news outlets, which all seem to bottom out in data from Similarweb. I was not able to find a detailed report, but it looks like they have more data behind a paywall. I think it’s reasonable to accept this claim for now, but, again, it might be different in some way from what the media is reporting1.
Setting records and growth of other apps
Claims of record setting
I saw people sharing graphs that showed the number of users over time for various apps and services. Here is a rather hyperbolic example:
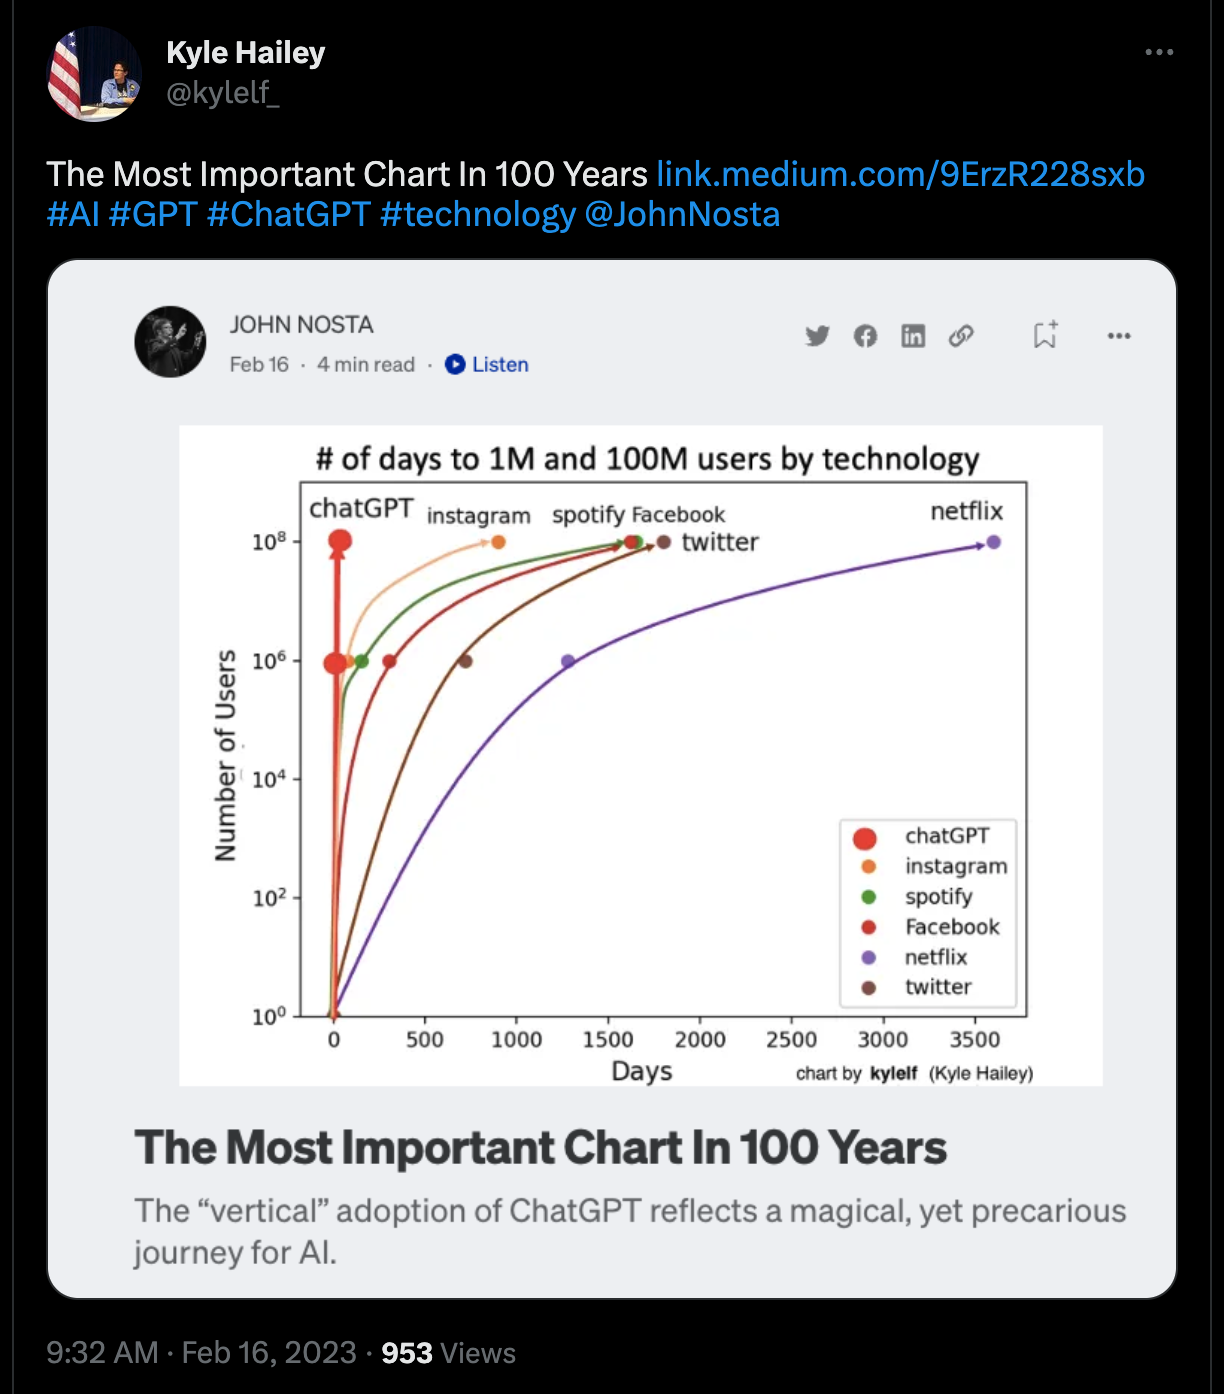
That’s an impressive curve and it reflects a notable event. But it’s missing some important data and context.
The claim that this set a record seems to originate from a comment by an analyst at investment bank UBS, who said “We cannot remember an app scaling at this pace”, which strikes me as a reasonable, hedged thing to say. The stronger claim that it set an outright record seems to be misreporting.
Data on other apps
I found data on monthly users for all of these apps except Spotify2. I also searched lists of very popular apps for good leads on something with faster user growth. You can see the full set of data, with sources, here.3 I give more details on the data and my methods in the appendix.
From what I can tell, that graph is reasonably accurate, but it’s missing Pokémon GO, which was substantially faster. It’s also missing the Android release of Instagram, which is arguably a new app release, and surpassed 1M within the first day. Here’s a table summarizing the numbers I was able to find, listed in chronological order:
| Service | Date launched | Days to 1M | Days to 10M | Days to 100M |
| Netflix subscribers (all) | 1997-08-29 | 3669 | 4185 | 7337 |
| 2004-02-04 | 331 | 950 | 1608 | |
| 2006-07-15 | 670 | 955 | 1903 | |
| Netflix subscribers (streaming) | 2007-01-15 | 1889 | 2351 | 3910 |
| Instagram (all) | 2010-10-01 | 61 | 362 | 854 |
| Instagram (Android) | 2012-04-03 | 1 | ||
| Pokemon Go (downloads) | 2016-07-05 | 7 | 27 | |
| ChatGPT | 2022-11-30 | 4 | 61 |
It’s a little hard to compare early numbers for ChatGPT and Pokémon GO, since I couldn’t find the days to 1M for Pokémon GO or the days to 10M for ChatGPT, but it seems unlikely that ChatGPT was faster for either.
Analysis
Scaling by population of Internet users
The total number of people with access to the Internet has been growing rapidly over the last few decades. Additionally, the growth of social networking sites makes it easier for people to share apps with each other. Both of these should make it easier for an app to spread. With that in mind, here’s a graph showing the fraction of all Internet users who are using each app over time (note the logarithmic vertical axis):
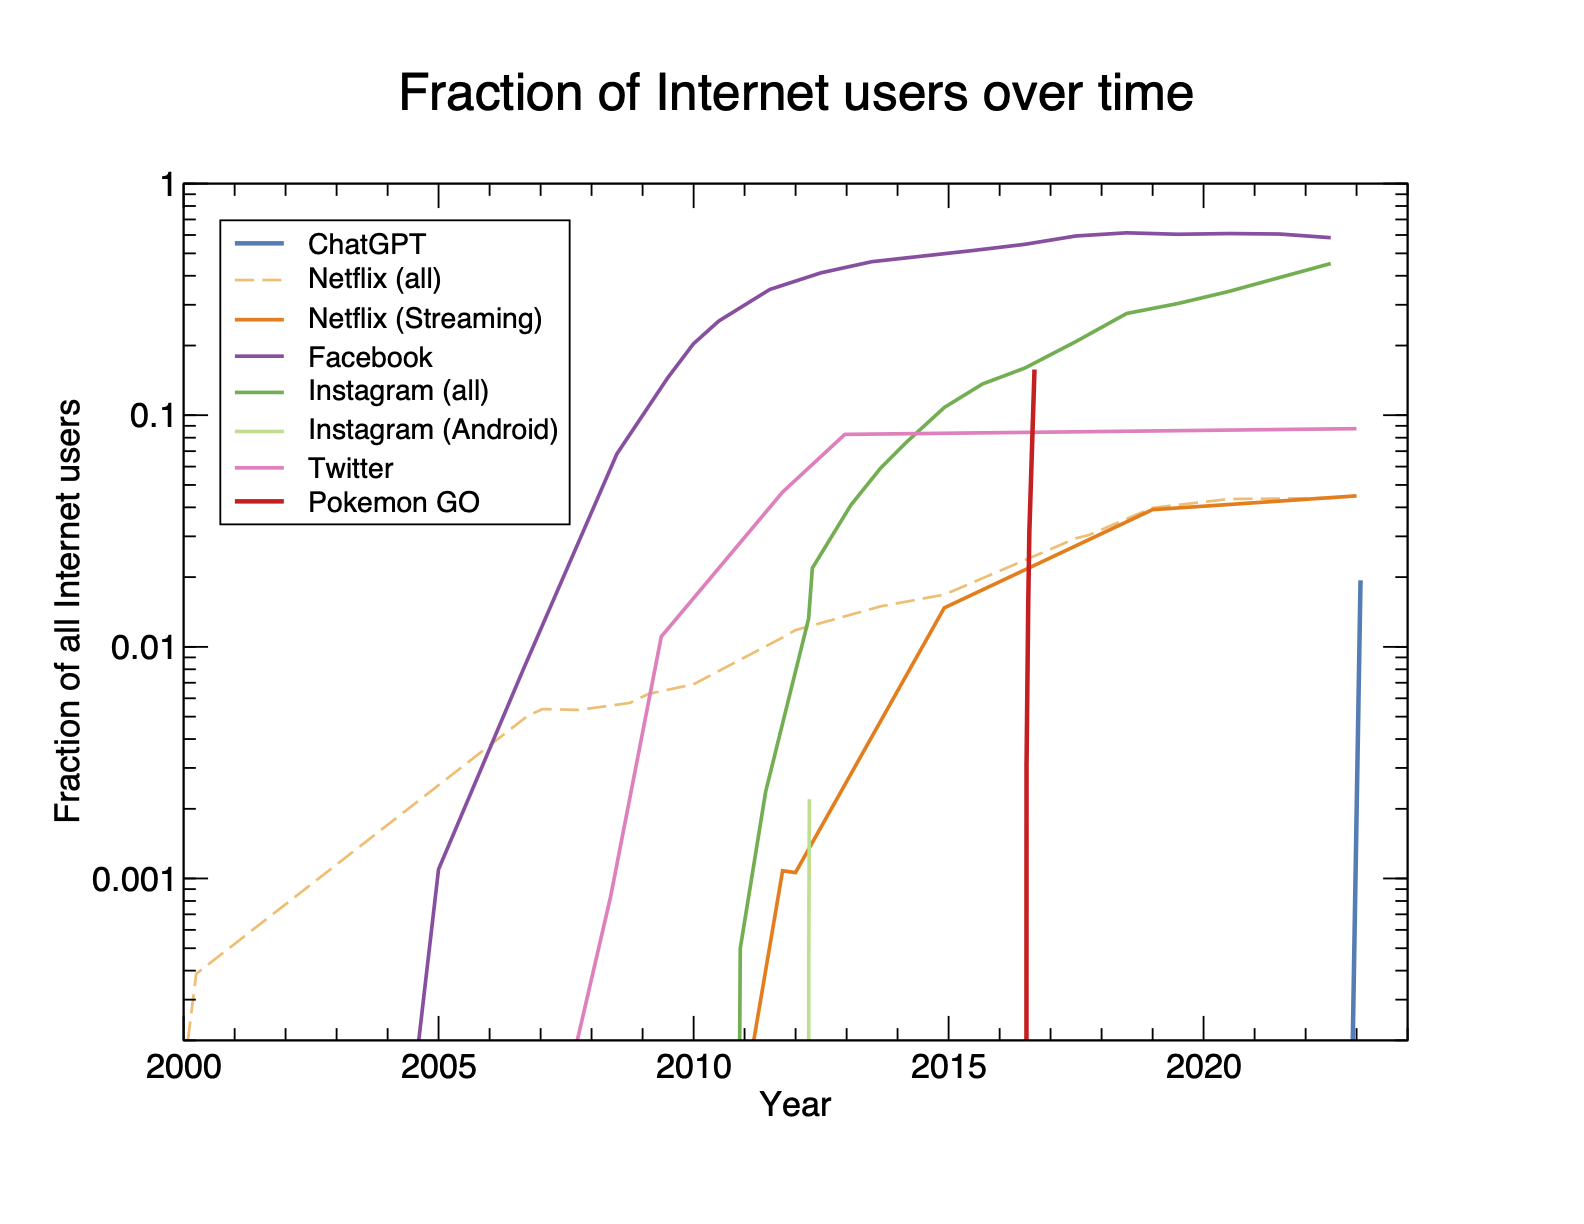
In general, it looks like these curves have initial slopes that are increasing with time, suggesting that how quickly an app can spread is influenced by more than just an increase in the number of people with access to the Internet. But Pokémon GO and ChatGPT just look like vertical lines of different heights, so here’s another graph, showing the (logarithmic) time since launch for each app:
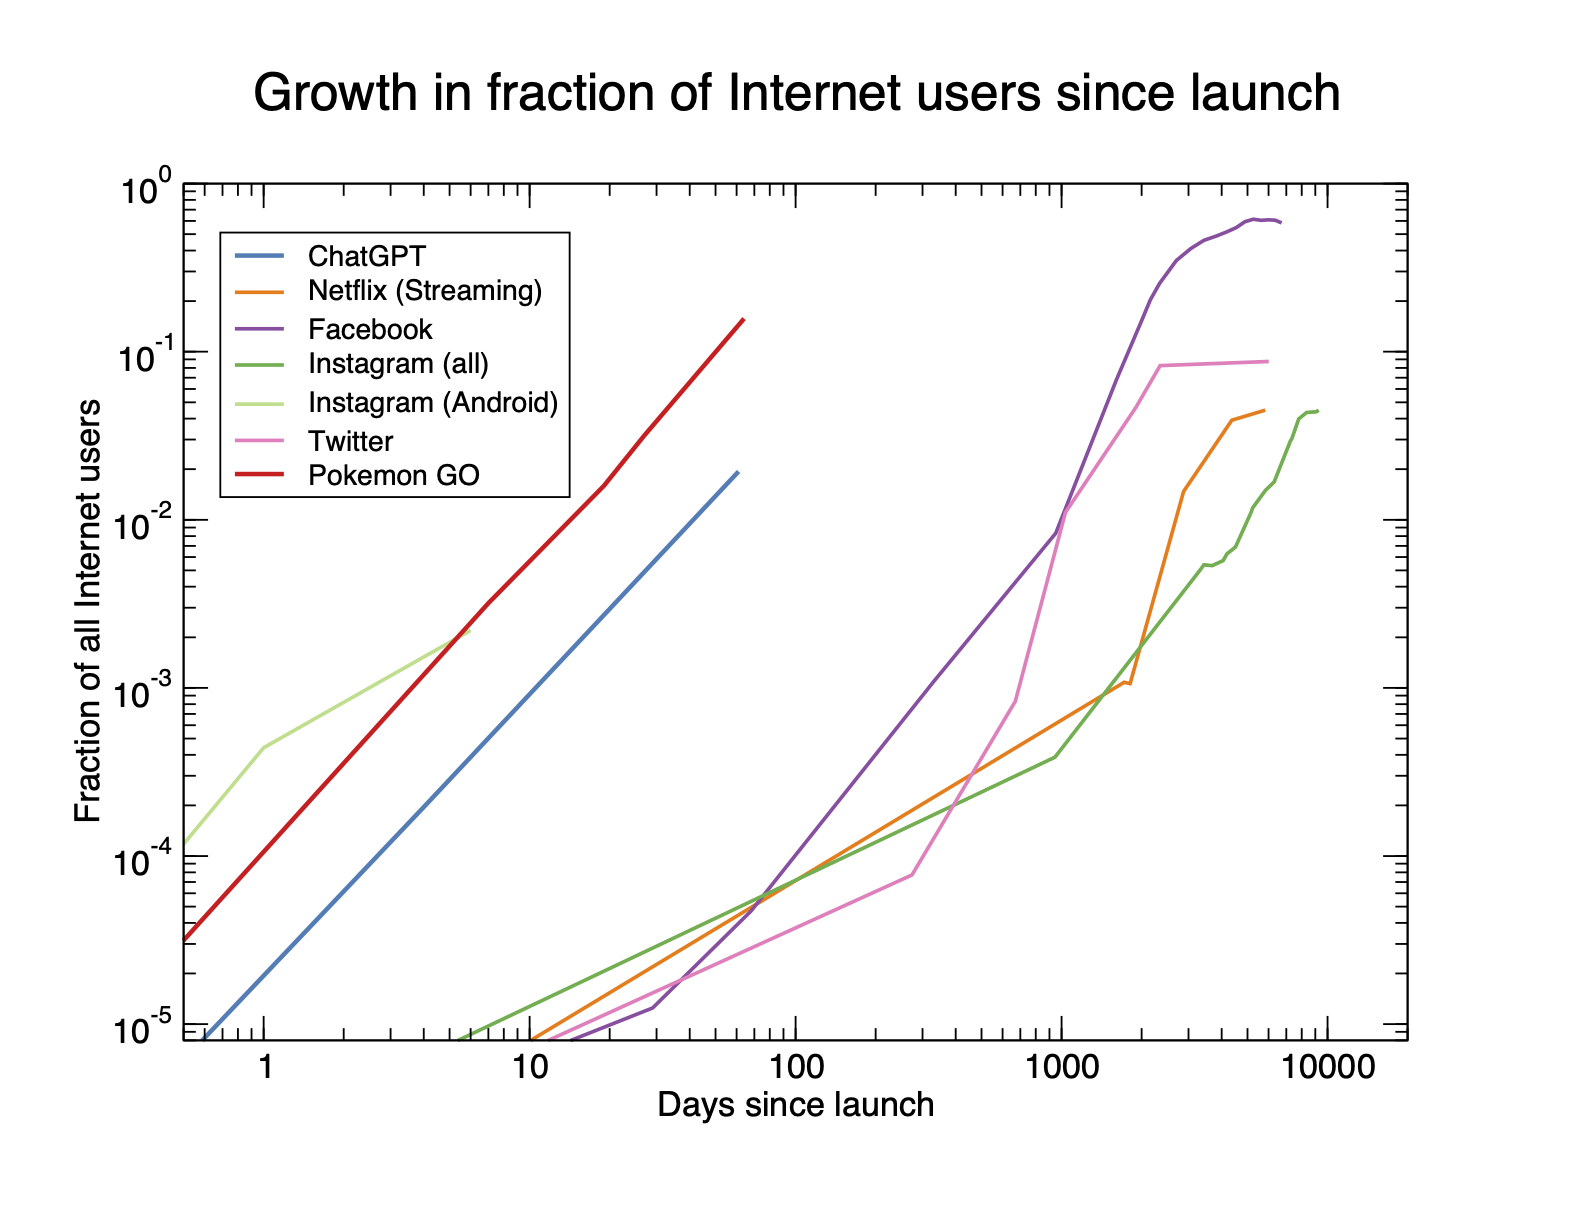
This shows pretty clearly that, while ChatGPT is an outlier, it was nonetheless substantially slower than Pokémon GO4.
Additional comparisons
One more comparison we can make is to other products and services that have a very fast uptake with users and how their reach increases over time:
YouTube views within 24 hours for newly posted videos gives us a reference point for how quickly a link to something on the Internet can spread and get engagement. The lower barrier to watching a video, compared to making an account for ChatGPT, might give videos an advantage. Additionally, there is presumably more than one view per person. I do not know how big this effect is, but it may be large.
Pay-per-view sales for live events, in this case for combat sports, are a reference point for something that people are willing to pay for to use at home in a short timeframe. The payment is a higher barrier than making an account, but marketing and sales can happen ahead of time.
Video game sales within 24 hours, in some cases digital downloads, are similar to pay-per-view, but seem more directly comparable to a service on a website. I would guess that video games benefit from a longer period of marketing and pre-sales than PPV, but I’m not sure.
Here is a graph of records for these things over time, with data taken from Wikipedia5, which is included in the data spreadsheet. Each dot is a separate video, PPV event, or game, and I’m only including those that set 24 hour records:
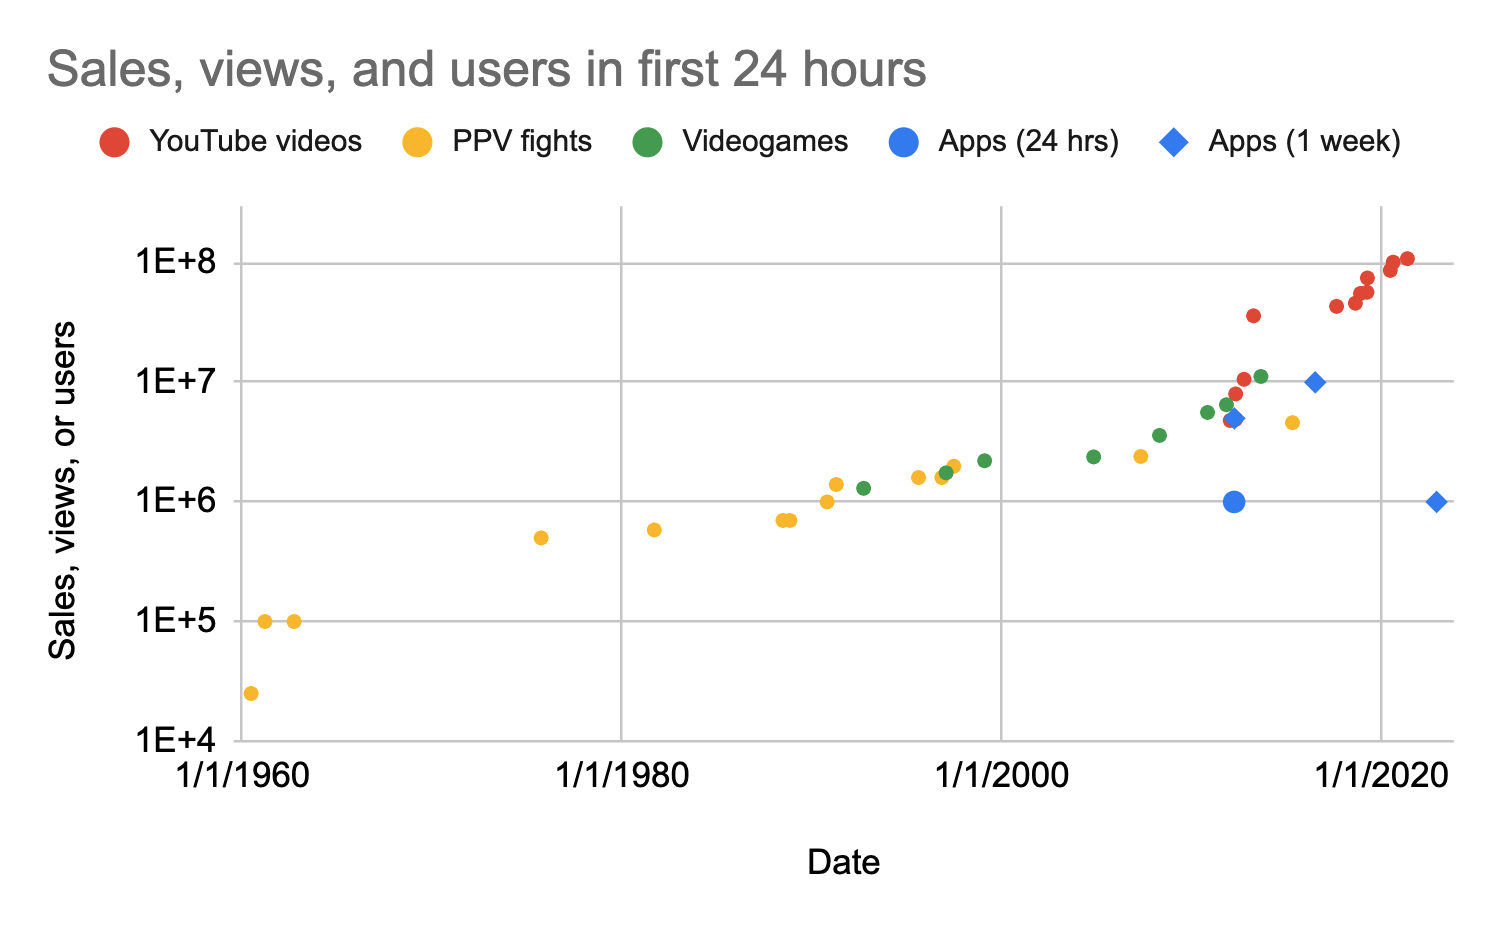
It would appear that very popular apps are not as popular as very popular video games or videos. I don’t see a strong conclusion to be drawn from this, but I do think it is helpful context.
Additional considerations
I suspect the marketing advantage for Pokémon GO and other videogames is substantial. I do not remember seeing ads for Pokémon GO before its release, but I did a brief search for news articles about it before it was released and found lots of hype going back months. I did not find any news articles mentioning ChatGPT before launch. This does not change the overall conclusion, that the claim about ChatGPT setting an outright record is false, but it should change how we think about it.
That ChatGPT was able to beat out most other services without any marketing seems like a big deal. I think it’s hard to sell people on what’s cool about it without lots of user engagement, but the next generation of AI products might not need that, now that people are aware of how far the technology has come. Given this (and the hype around Bing Chat and Bard), I would weakly predict that marketing will play a larger role in future releases.
Appendix – methods and caveats
Most of the numbers I found were for monthly users or, in some cases, monthly active users. I wasn’t always sure what the difference was between these two things. In some cases, all I was able to find was monthly app downloads or annual downloads, both of which I would naively expect to be strictly larger than monthly users. But the annual user numbers reflected longer-term growth anyway, so they shouldn’t affect the conclusions.
Some of the numbers for days to particular user milestones were interpolated, assuming exponential growth. By and large, I do not think this affects the overall story too much, but if you need to know precise numbers, you should check my interpolations or find more direct measurements. None of the numbers is extrapolated.
When searching for data, I tried to use either official sources like SEC filings and company announcements, or measurements from third-party services that seem reputable and have paying customers. But sometimes those were hard to find and I had to use less reliable sources like news reports with dubious citations or studies with incomplete data.
I did not approach this with the intent to produce very reliable data in a very careful way. Overall, this took about 1-2 researcher-days of effort. Given this, it seems likely I made some mistakes, but hopefully not any that undermine the conclusions.
Thanks to Jeffrey Heninger and Harlan Stewart for their help with research on this. Thanks to the two of them and Daniel Filan for helpful comments.
FWIW, there’s an article somewhere quoting an OAer saying that the real number was more like half that.
Of course, what means is still highly ambiguous. Accounts which logged in and tried at least one prompt ever? They couldn’t know a more reasonable metric like ‘monthly average users’ at the time, of course, but they should have a better idea of ChatGPT staying power now. And then you have the fact that people love to abuse free services: not long after launch, people were wrapping it to use it as a free API, and because many countries don’t have access (like ChatGPT), there were services routinely popping up offering covert access (especially in China). Playing Whac-a-mole with all these abusers would drastically inflate accounts as they get created, used, and eventually banned.
The original chart is misleading in more ways than one. Facebook, Netflix et al might be household names now, but this has more to do with their staying power and network effects than any sort of exceedingly fast adoption.
I also suspect that chatGPT has a bunch of inactive accounts, as it’s essentially a toy without an actual use-case for most people.
I mean, Pokémon is insanely popular, so something being less popular than some pokémon game doesn’t necessarily mean anything.
Right, but being more popular than the insanely popular thing would be pretty notable (I suppose this is the intuition behind the “most important chart of the last 100 years” post), and that’s not what happened.