
The CDC nowcast last week was 2.7% Omicron. That seemed like a reasonable guess.
The CDC nowcast this week is 73% Omicron, and last week’s nowcast got revised from 2.7% to 12.6%.
That’s two retroactive extra doublings last week, and then four more in the following seven days relative to Delta, for a doubling time of less than two days.
That report came out right after I put out Omicron Post #8, and I quickly noticed I was confused.

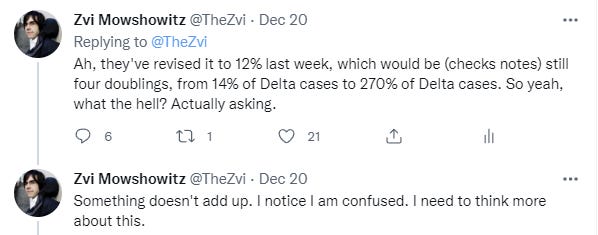
One possibility is, hey, large error bars, so I guess there’s that?
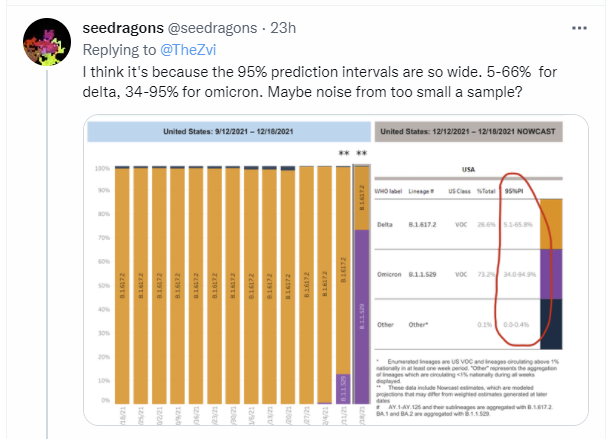
This conversation provided potential factors, but did not clear up the confusion.

This provides a clear alternate hypothesis, and I trust the source quite a bit.
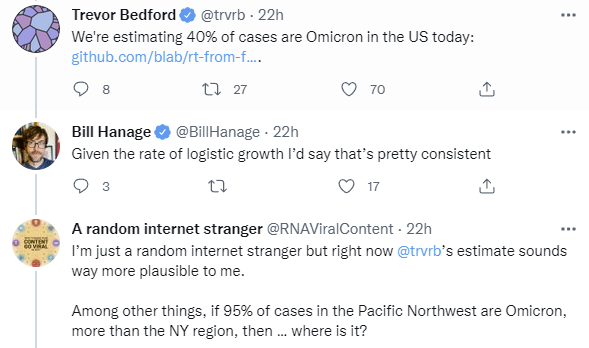

Censoring the past ten days is quite a high price to pay given how fast things are moving. That’s a lot of data to give up, and it’s worth noting that 10 days later the difference between 40% and 73% isn’t all that big in context. But if Trevor is right about the speed of submission, and the Nowcast isn’t adjusting, it’s going to give out a nonsense answer.
Which is exactly what it is giving. There are three huge problems with the nowcast’s answer, on top of the revision being rather large and not inspiring confidence.
Where are all the cases?
The regional numbers make even less sense.
Also, it’s averaging over a week so it’s implying even higher rates now.
The third problem I only noticed later, but if it’s 73% for the whole week, and 12% for last week, where did we enter the week, and therefore how high did we have to get to balance out the first few days? Not that this problem is necessary to notice the flaws.
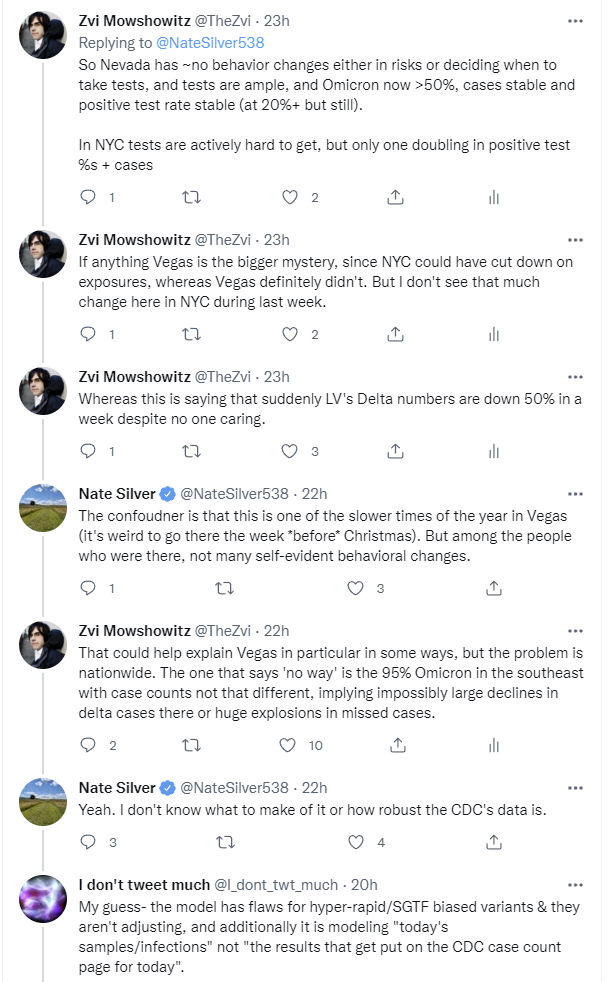
The first issue jumped out at me right away. We know that there wasn’t a dramatic rise in the number of cases overall. We know there wasn’t a rise in the positive test percentage. Yet the claim is there was suddenly, over the whole week, three times as many Omicron cases as Delta. Does that mean that the number of Delta cases was down by more than half inside of a week? Does that seem remotely possible?
Testing capacity is a limiting factor, but if it was having a big effect, we’d presumably be seeing a much bigger jump in the positive test rate. I can imagine a world where that’s not true, but it doesn’t match the data from earlier in the pandemic.
This gets far more extreme if you go to the regional level, and the implications get bonkers.
This was a good visualization of the nowcast by region.
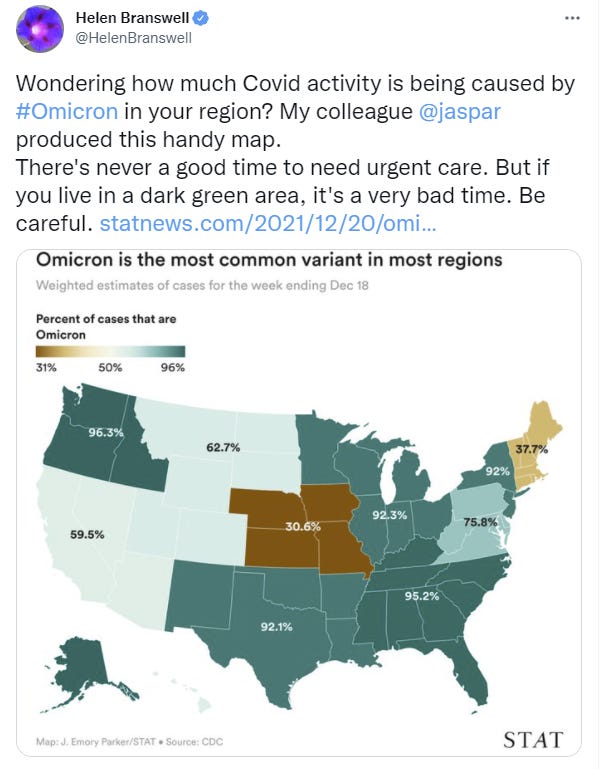
This means that in two regions covering ten states, we had more than 95% Omicron cases, so twenty Omicron cases for every Delta case, whereas a week ago Omicron was a clear minority of cases. Does that possibly live in the same world as our case counts?
This is another good explanation of some of the reasons the data doesn’t add up. This is how one should approach the situation when algorithms produce obvious nonsense. As he notes, this isn’t a knock on the CDC. I can be harsh on the CDC, but this isn’t the time and place for that. It is an example of them doing their best to be helpful, and failing to notice that their algorithm had produced nonsense because they didn’t have a human look at it.
And sure, given how many eyes were on the forecast they should have had a human do a sanity check and put in a warning note. But they also shouldn’t have had to. Everyone else should have also noticed they were confused and that the number didn’t make sense, rather than reporting an obvious nonsense projection with huge error bars as if it were a fact. If I were at the CDC, I’d fix the ‘no human sanity check’ issue but also would be muttering about how this is why we can’t have nice things.
It would be better to not give obvious nonsense as an output, but that’s a lot to ask here. It’s really really hard to create an algorithm that always produces an answer and never produces obvious nonsense. That’s especially true in new situations with different properties that are warping your data. I have a bunch of experience trying to create models of much better-understood situations without producing obvious nonsense, and of watching others make their own attempts, and yeah. It’s hard.
Sure, sure, use the try harder, Luke, sanity check it for five minutes and all that, it’s not like this requires Shutting Up and Doing the Impossible, at most you need to Make an Extraordinary Effort, but this was at least them making a perfectly reasonable ordinary effort to do exactly the right thing. It isn’t the usual situation of our authorities Trying to Try.
There’s even a button to turn off the nowcast.
It also means that when statements like this one from the Stat News article are made, they are an honest misunderstanding, in that they are categorizing the CDC as making a much stronger claim than they actually are.
According to the CDC, in the week ending Nov. 27, the Delta variant accounted for virtually all transmission in the country. The week ending Dec. 4, Omicron made up 0.7% of Covid infections; it climbed to 12.6% in the week ending Dec. 11. In the week ending Dec. 18, it reached 73.2%.
As opposed to at most something like this rewording I’d offer, which really should then end ‘While the growth in Omicron is dramatic and faster than expected, the full nowcast projection does not actually seem plausible give our other data sources’ or something similar:
According to the CDC, in the week ending Nov. 27, the Delta variant accounted for virtually all transmission in the country. The week ending Dec. 4, Omicron made up 0.7% of Covid infections. According to the CDC’s automated nowcast projection, it then climbed to 12.6% in the week ending Dec. 11, and 73.2% for the week of the Dec. 18, with very large error bars.
Trevor’s projections seem far more sane, including when they are extended into the future. The loss of the last ten days is unfortunate and limits their usefulness, but not that much since one can extrapolate. We lose out on noticing any changes in behavior and therefore spread, but the ratio of Omicron to Delta should be mostly as predicted.
Why Does It Matter?
The difference between 40% and 73% Omicron is likely to be something like four days even under relatively conservative projections. It’s all going to be all Omicron soon, and even if the projection is a week ahead all the relevant prediction markets will settle correctly anyway. Why should we care about the current percentage?
Two reasons. There’s the usual reason to always care, and also the implications of the 73% number would be bizarre and force large modifications in our world model.
We should always care to get things right, to learn how to get things right, and to cultivate the virtue of making sure to get things right, and to identify epistemic errors so they can be fixed both individually and systemically.
The next time the media runs similar headlines, you’ll want to notice their conflation of projection and measurement, and also notice you are confused right away, and react accordingly. It’s important to recognize the difference between a measurement and a projection, and have heuristics for which projections have how much credibility.
If we were already at 73% Omicron last week (with 95%+ in some regions) then as was discussed above, where the hell are the cases?
If positive test rates were mostly stable, and cases were mostly stable, but Omicron was three quarters of cases, then that implies a stunning decline in Delta. While Omicron was doubling every two days, Delta would have to be getting cut in half every three.
That in turn implies, in that counterfactual world:
A stunning shift in behaviors, far larger than any previous changes throughout the pandemic. Spread would have been cut, on a dime, by more than half.
This cut in spread somehow still didn’t much slow down Omicron.
The relative R0 of Omicron versus Delta would be even higher than the highest other estimates.
Omicron would be completely unstoppable.
Throughout the pandemic, we’ve had a lot of different sources of information: Deaths, hospitalizations, cases, prevention methods, restrictions and behaviors, variant properties and how much of each is where when, generation times (serial intervals), levels of natural immunity, vaccine effectiveness, methods of spread, population heterogeneity and more.
They all must fit together into a single world with a single set of physical properties. When one measurement is out of whack, if you accept it, it can have implications that throw your entire model off.
If people have any confidence at all that the CDC is wrong, this market looks like free money. (Which is both further evidence for markets overinterpreting the most recent data, and evidence that the mostly-efficient prediction market thinks the crazily increasing numbers will actually mostly check out, at the same time.)
Just qualitatively eyeballing, the Boston wastewater data does look roughly like what I’d expect to see in a world where Omicron took over last week. And I consider that the single best US data source available—it is immune to almost all of the lag and selection effects which impact most other sources. It is the closest thing we have to a proper ground truth.
Omicron taking over late last week/early this week, at least in major urban centers, also matches what we’ve seen in London, and a priori I’d expect pretty similar timing here. I wouldn’t expect that we had substantially less international travel, or substantially slower spread; if anything, I’d expect things here to be a little faster a priori.
So, I agree the CDC’s data is not particularly informative on the currently-relevant timescale, but it seems pretty plausible to me that it’s off in the “Omicron cases were way underestimated, and total cases now are way underestimated” direction rather than the “Omicron cases now are way overestimated” direction.
Now I’m confused too. Asking “where the hell are the cases?” seems to imply that, if case counts had doubled this week, we would know this week? The intuition I’ve picked up from posts with more pictures, which give me a greater sensation of understanding, is that different metrics come in at very different times: tests estimate how many people are contagious about as fast as the data gets shared from the test results, which can be on the scale of hours to weeks… test results lag behind what they’re actually measuring by hours to days… hospitalizations have historically followed infections by several days or a couple weeks, with death counts trailing days-months behind hospitalizations because, frankly and gruesomely, people take days-weeks to die once hospitalized.
So it seems like the big question, this early in a variant that seems to spread much faster, isn’t “where are the cases now”, but “when should we expect to see the cases in the various metrics we follow?”.
Also, I don’t follow why it’s implausible that omicron might be wildly out-competing delta without a huge change in the overall case count? It seems like peoples’ behaviors, especially around vaccinating or not and willingness to share air indoors, create a relatively fixed segment of the population who act like generally good hosts for covid, vs those who act like generally bad ones. With no behavior change, if we assume for simplicity that delta and omicron are competing only within that good-host population and that there’s a fixed rate of reinfection/immunity across variants, couldn’t omicron almost stomp out delta? For the current level of uncertainty, I don’t follow why it’s so implausible that an average increased transmissibility and decreased severity for omicron could roughly cancel each other out in the overall “any kind of covid” case counts. Then again, I am absolutely not even an armchair epidemiologist, so my speculation might be obvious wrong to those with more knowledge based on facts I simply haven’t met yet.
I’m trying to see what makes those numbers so implausible, and as far as I understand (at least without looking into regional data) the most surprising/suspicious thing is that number of new cases of Delta is dropping too fast.
But why shouldn’t it be dropping fast? Odds of people getting Omicron (as opposed to Delta) are growing fast enough—if we assume that they are (# of Omicron cases)/(# of Delta cases)*(some coefficient like their relative R_0), then due to Omicrons’s fast doubling it can go from 1:2 to 4:1 in just a week. That will make new Delta cases among the population for which Omicron and Delta compete (as in they are destined to get one or the other) drop from 66% to 20% -- more than three times.
In real world there are no people destined to get Covid. But there are unvaccinated people that go unmasked to a club with hundreds of other people like them—and continue to do it until they get Covid. This and other similar modes of behavior seem like a close enough approximation of “people destined to get a covid”. Is it close enough? Are there enough of people like that compared to people for whom Omicron and Delta don’t compete that much? I don’t know, quite possibly not.
Does it mean that in order to notice that nowcasts’ data is suspicious, I must have some knowledge about how different variants compete with each other? Can someone ELIU to me how this competition happens? Am I missing something else?