Summary: Understanding and controlling a maze-solving policy network analyzed a maze-solving agent’s behavior. We isolated four maze properties which seemed to predict whether the mouse goes towards the cheese or towards the top-right corner:
In this post, we conduct a more thorough statistical analysis, addressing issues of multicollinearity. We show strong evidence that (2) and (3) above are real influences on the agent’s decision-making, and weak evidence that (1) is also a real influence. As we speculated in the original post,[1] (4) falls away as a statistical artifact.
Peli did the stats work and drafted the post, while Alex provided feedback, expanded the visualizations, and ran additional tests for multicollinearity. Some of the work completed in Team Shard under SERI MATS 3.0.
Impressions from trajectory videos
Watching videos Langosco et al.’s experiment, we developed a few central intuitions about how the agent behaves. In particular, we tried predicting what the agent does at decision squares. From Understanding and controlling a maze-solving policy network:
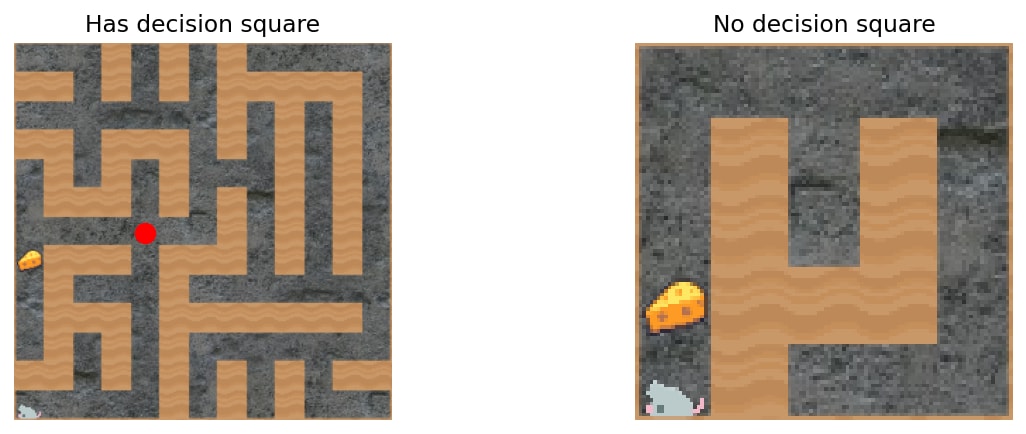
Some mazes are easy to predict, because the cheese is on the way to the top-right corner. There’s no decision square where the agent has to make the hard choice between the paths to the cheese and to the top-right corner:
At the decision square, the agent must choose between two paths—cheese, and top-right.
Here are four central intuitions which we developed:
Closeness between the mouse and the cheese makes cheese-getting more likely
Closeness between the mouse or cheese and the top-right makes cheese-getting more likely
The effect of closeness is smooth
Both ‘spatial’ distances and ‘legal steps’ distances matter when computing closeness in each case
The videos we studied are hard to interpret without quantitative tools, so we regard these intuitions as theoretically-motivated impressions rather than as observations. We wanted to precisify and statistically test these impressions, with an eye to their potential theoretical significance.
We suspect that the agent’s conditions for pursuing cheese generalize properties of historically reinforced cheese-directed moves in a very “soft” way. Consider that movements can be “directed” on paths towards the cheese, the top-right corner, both, or neither. In the training environment, unambiguously cheese-directed movements are towards a cheese square that is both close to the mouse’s current position and close to the top-right.[2]
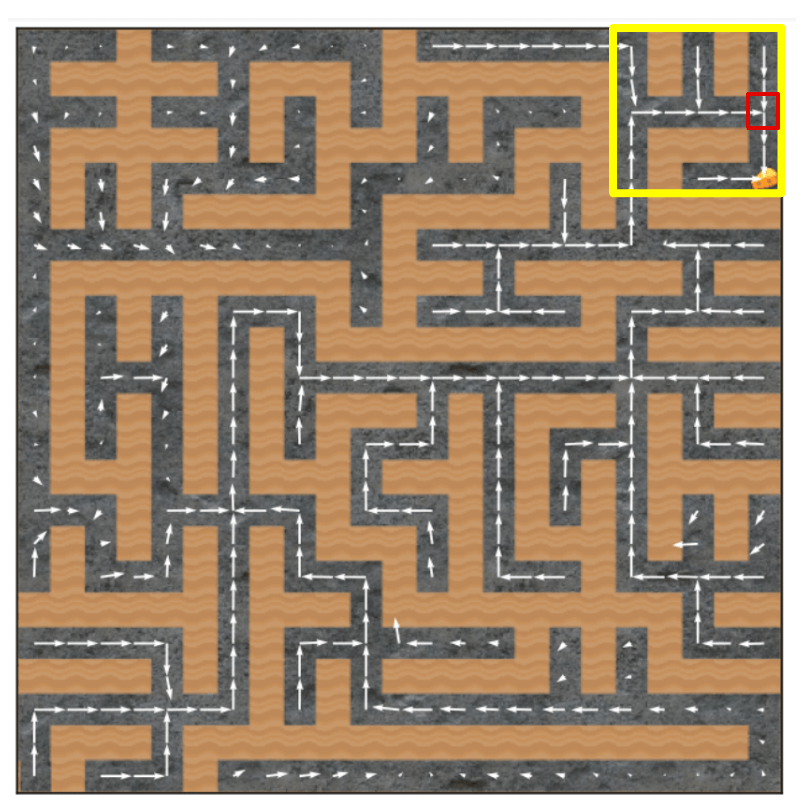
Decision-square in red. We outline in yellow the 5x5 region where cheese can appear during training. In almost all cases that can arise in training, the decision-square is inside the 5x5 region. Unambiguously cheese-seeking moves are almost always moves to a nearby cheese square which is close to the top-right.
Our impression is that in the test environment, “closeness to top-right” and “closeness to cheese” each become a decision-factor that encourages cheese-directed movement in proportion to “how strongly” the historical condition holds at present. In shard theory terminology, the top-right- and cheese-shards seem to activate more strongly in situations which are similar to historical reinforcement events.
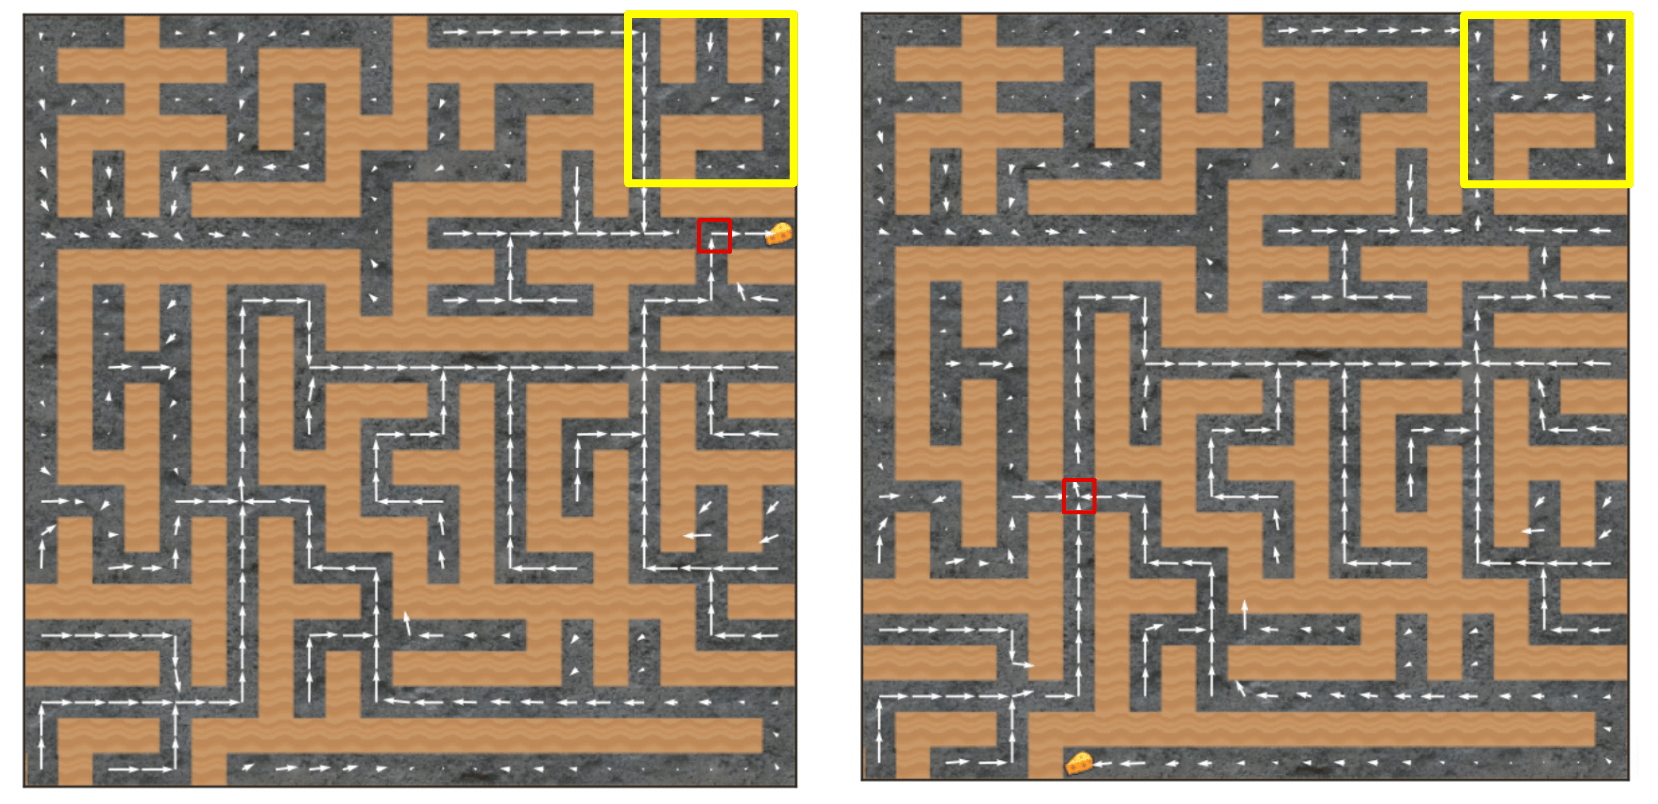
The maze on the left is intuitively similar to training mazes: the decision-square, cheese, and top-right are all close to each other. In the maze on the right, the decision-square, cheese, and top-right aren’t particularly close to each other.
A second important aspect of our impressions was that the generalization process “interprets” each historical condition in multiple ways: It seemed to us that (e.g.) multiple kinds of distance between the decision-square and cheese may each have an effect on the agent’s decision making.
Statistically informed impressions
Our revised, precisified impressions about the agent’s behavior on decision-squares are as follows:
Legal-steps closeness between the mouse and the cheese makes cheese-getting more likely
These distances smoothly affect P(cheese acquired), without rapid jumps or thresholding
Spatial closeness between the mouse and the cheese makes cheese-getting slightly more likely, even after controlling for legal-steps closeness (low confidence)
After extensive but non-rigorous statistical analysis (our stats consultant tells us there are no low-overhead rigorous methods applicable to our situation), we believe that we have strong quantitative evidence in favor of versions of impressions 1) through 3), and weak quantitative evidence in favor of a version of impression 4).
Because our statistical procedure is non-rigorous, we are holding off on drawing strong conclusions from these impressions until we have a more robust, mechanistic-interpretability informed understanding of the underlying dynamics.
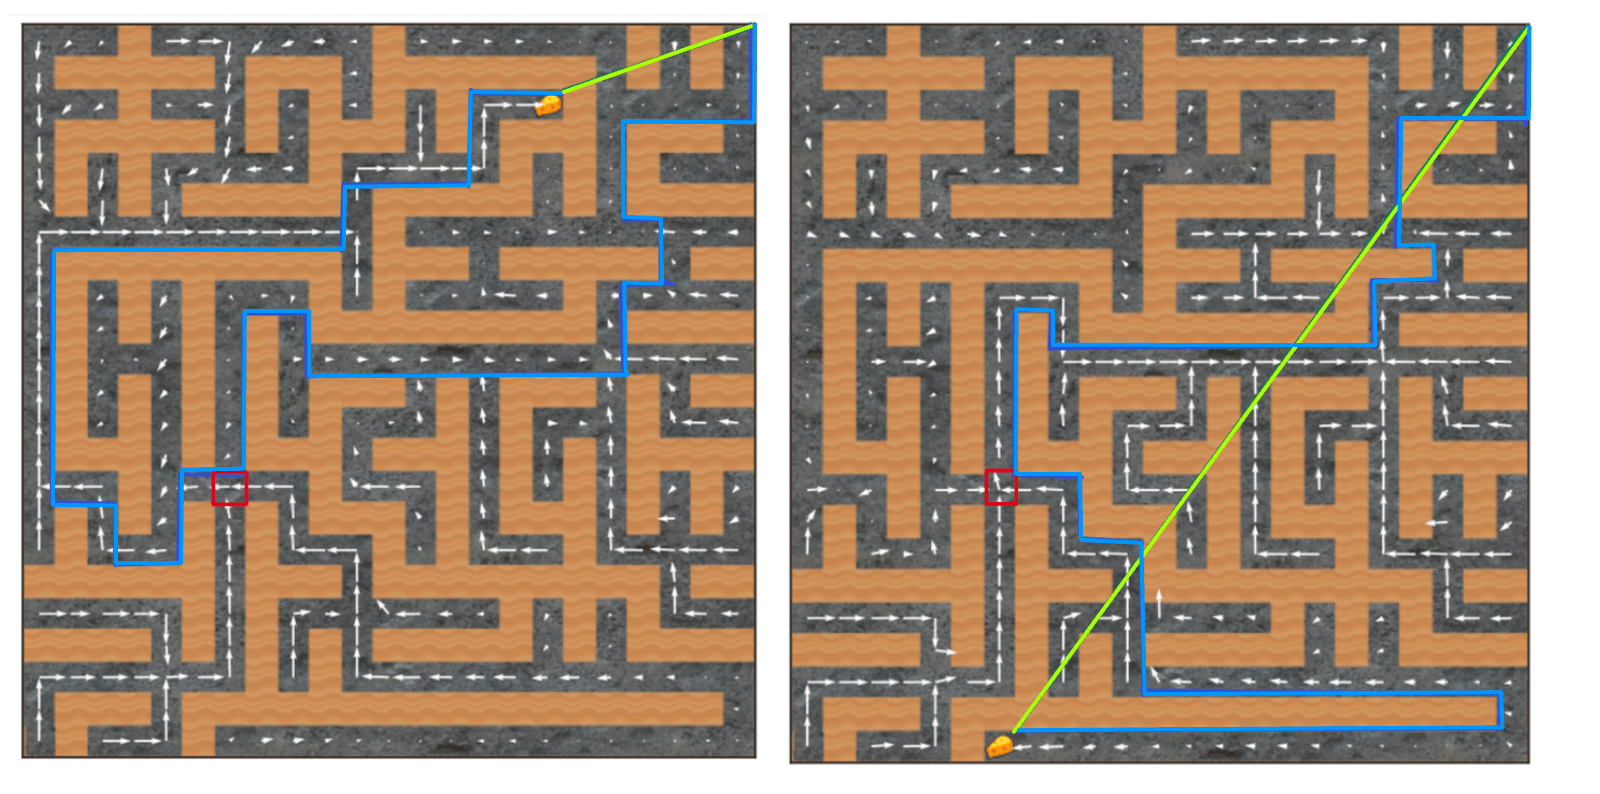
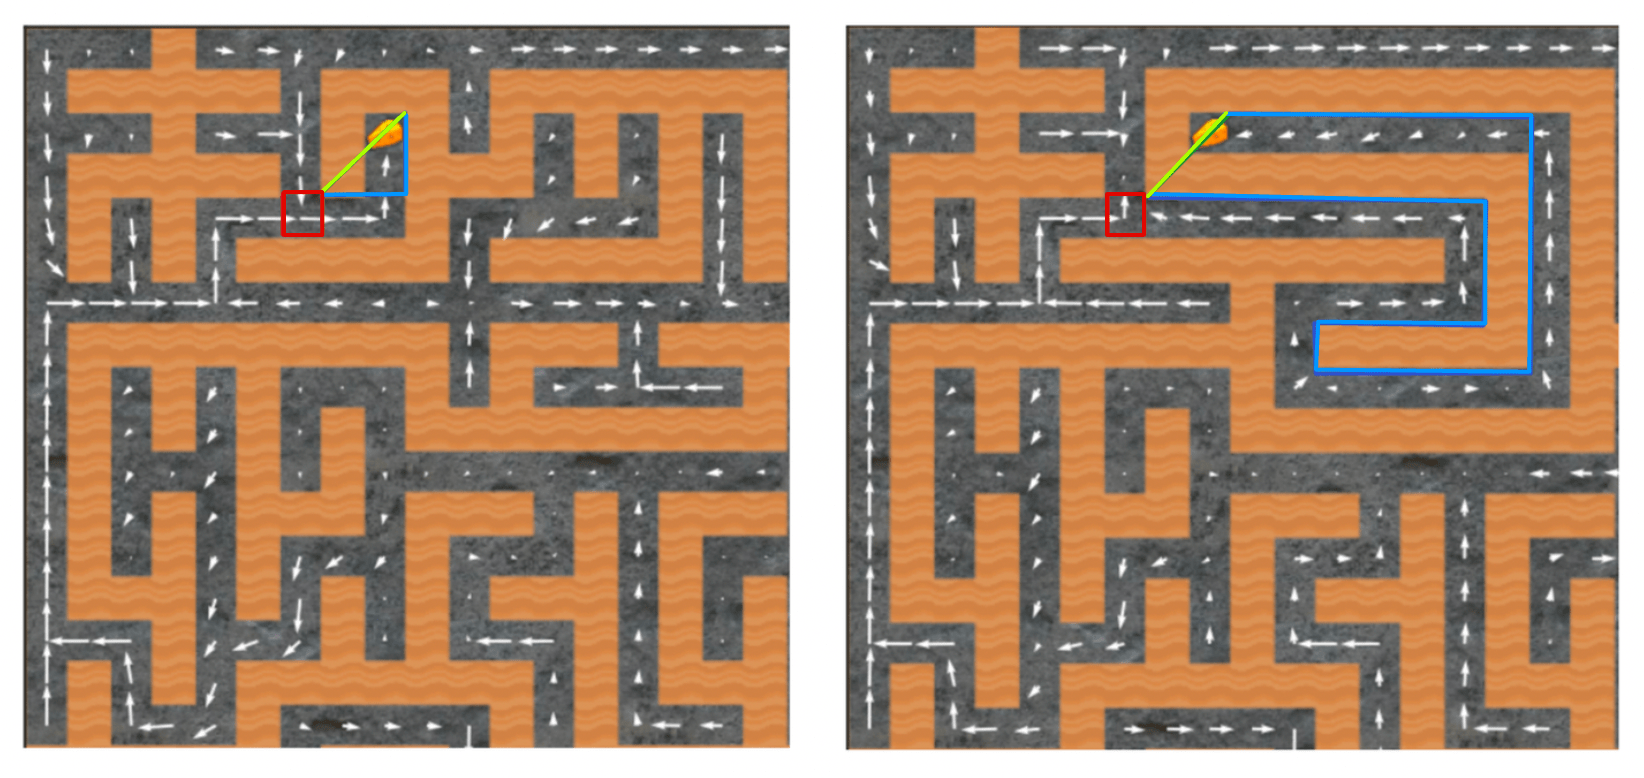
One question that interests us, however, is whether these impressions point to a decision-making process that is more ‘shard-like’ than ‘utility-theoretic’ in character. When we originally studied test-run videos, we wondered whether the apparent “closeness effects″ could be explained by a simple utility function with time-discounting (for example a fixed value cheese-goal and fixed value corner-goal). The evidence that at least some spatial closeness effects are irreducible to legal-steps closeness seem to rule out such simple utility functions, since only legal-steps closeness matters for time-discounting:
Step-distance in blue, Euclidean distance in green. A time-discounting agent with an otherwise fixed-value corner goal and fixed-value cheese goal should prioritize cheese-getting (almost) equally on the left maze and the right maze.
Our current intuition is that a predictively strong utility function needs to incorporate spatial distances in multiple complex ways.
We think the complex influence of spatial distances on the network’s decision-making might favor a ‘shard-like’ description: a description of the network’s decisions as coalitions between heuristic submodules whose voting-power varies based on context. While this is still an underdeveloped hypothesis, it’s motivated by two lines of thinking.
First, we weakly suspect that the agent may be systematically[3] dynamically inconsistent from a utility-theoretic perspective. That is, the effects of dstep(mouse,cheese) and (potentially) dEuclidean(cheese,top-right) might turn out to call for a behavior model where the agent’s priorities in a given maze change based on the agent’s current location.
Second, we suspect that if the agent is dynamically consistent, a shard-like description may allow for a more compact and natural statement of an otherwise very gerrymandered-sounding utility function that fixes the value of cheese and top-right in a maze based on a “strange” mixture of maze properties. It may be helpful to look at these properties in terms of similarities to the historical activation conditions of different submodules that favor different plans.[4]
While we consider our evidence suggestive in these directions, it’s possible that some simple but clever utility function will turn out to be predictively successful. For example, consider our two strongly observed effects: dEuclidean(cheese,top-right)and dstep(decision-square,cheese). We might explain these effects by stipulating that:
On each turn, the agent receives value inverse to the agent’s distance from the top-right,
Sharing a square with the cheese adds constant value,
The agent doesn’t know that getting to the cheese ends the game early, and
The agent time-discounts.
We’re somewhat skeptical that models of this kind will hold up once you crunch the numbers and look at scenario-predictions, but they deserve a fair shot.
We hope to revisit these questions rigorously when our mechanistic understanding of the network has matured.
Our first step to statistically evaluating our initial impressions about the network’s behavior was to operationalize the concepts featured in our impressions. And since we suspected that the training process generalizes historically significant properties in multiple simultaneous ways, we came up with multiple operationalizations of each relevant concept when possible:
‘Top-right’: top-right maze square or 5x5 squares area starting from top-right maze square
‘Distance’: legal-steps distance or inverse of Euclidean distance
‘Distance to top-right’: cheese closeness to top-right or decision-square closeness to top-right
‘Distance to cheese’: decision-square closeness to cheese
Our next step was to generate every operationalization of ‘closeness to top-right’ and ‘closeness to cheese’ we can construct using these concepts, and do a logistic regression on each to measure its power to predict whether the agent gets the cheese.[5]
Individual regression results: cheese-to-decision-square and cheese-to-top-right distances are predictive
We generated 10,000 trajectories (each in a different random seed) and screened them for levels which actually contain a decision-square. We were left with 5,239 levels meeting this criterion. We trained a regression model to predict whether the agent gets the cheese in any given seed. The baseline performance (either guessing “always cheese” or “never cheese”) gets an accuracy of 71.4%.
We performed logistic regression on each variable mentioned above, using a set of 10,000 runs with a randomized 80% training / 20% validation split and averaged over 1,000 trials. That is, we train regression models with single variable, and see what the accuracy is.
Out of 11 variables, 6 variables beat the ‘no regression’ accuracy baseline of 71.4%:
Variable
Prediction accuracy
Euclidean distance between cheese and top-right 5x5
0.775
Euclidean distance between cheese and top-right square
0.773
Euclidean distance between cheese and decision-square
0.761
Steps between cheese and decision-square
0.754
Steps between cheese and top-right 5x5
0.735
Steps between cheese and top-right square
0.732
The remaining 5 variables were worse than nothing:
Variable
Prediction accuracy
Cheese coordinates norm
0.713
Euclidean distance between decision-square and top-right square
0.712
Steps between decision-square and top-right square
0.709
Steps between decision-square and top-right 5x5
0.708
Euclidean distance between decision-square and top-right 5x5
0.708
Note that in these individual regressions, all successfully predictive variables have a negative coefficient—this makes sense, since the variables measure distance and our impression was that various forms of closeness motivate cheese-getting.
Variables are highly correlated, so we are on rocky statistical terrain
As we move on to multiple regressions to try finding out which variables drive these results, we have to work carefully: our various operationalizations of ‘closeness’ in the mazes are inevitably pretty correlated.
I’d be weary about interpreting the regression coefficients of features that are correlated (see Multicollinearity). Even the sign may be misleading.
It might be worth making a cross-correlation plot of the features. This won’t give you a new coefficients to put faith in, but it might help you decide how much to trust the ones you have. It can also be useful looking at how unstable the coefficients are during training (or e.g. when trained on a different dataset).
There is indeed a strong correlation between two of our highly predictive variables:
dstep(decision-square,cheese) and dEuclidean(decision-square,cheese) have correlation of .886.
We then computed the variation inflation factors for the three predictive variables we end up analyzing in detail. VIF measures how collinearity increases the variance of the regression coefficients. A score exceeding 4 is considered to be a warning sign of multicollinearity.
Attribute
VIF
Euclidean distance between cheese and top-right square
1.05
Steps between cheese and decision-square
4.64
Euclidean distance between cheese and decision-square
4.66
Our statistician friend suggested that in situations like this it’s most instructive to look at which individually predictive variables affect prediction accuracy when we add/drop them in a multiple regression, watching out for sign-flips. The procedure isn’t fully rigorous, but since much of our evidence is backed by qualitative ‘maze-editing’ experiments and domain knowledge, we are relatively confident in some conclusions.
Finding stably predictive variables with multiple regressions
Let’s take the predictively successful variables from the individual regressions—the variables that scored better than ‘no-regression’—and perform an L1 regularized multiple regression to see which variables remain predictive without sign-flipping. We average over 2000 randomized test/train splits:
Regression accuracy
84.1%
Attribute
Coefficient
Steps between cheese and top-right 5x5
-0.003
Euclidean distance between cheese and top-right 5x5
0.282
Steps between cheese and top-right square
1.142
Euclidean distance between cheese and top-right square
-2.522
Steps between cheese and decision-square
-1.200
Euclidean distance between cheese and decision-square
-0.523
Intercept
1.418
We see that three of our individually predictive variables made it through without a sign-flip:
Euclidean distance from cheese to top-right square
Legal steps distance from decision-square to cheese
Euclidean distance from decision-square to cheese
Variables 1)-3) line-up with our best guesses about mechanisms based on informal observation and (messy) exploratory statistics, so it’s good news that the simple procedure ‘check which individually significant variables don’t sign-flip’ recovers them.
These are also the three main features which we noted in the original post. (We had noted that the fourth feature dEuclidean(decision-square,5x5) has a strange, positive regression coefficient, which we thought was probably an artifact. Our further analysis supports our initial speculation.)
These decision-influences are probably not statistical artifacts
We’ve repeated this particular test dozens of time and got very consistent results: individually predictive variables outside 1)-3) always go near zero or sign-flip. Results also remained consistent on a second batch of 10,000 test-runs. Considering a range of regressions on a range of train/validation splits, the regression coefficient signs of (1)-(3) are very stable. The magnitudes[6] of the regression coefficients fluctuate a bit across regressions and splits, but are reasonably stable.
Furthermore, we regressed upon 200 random subsets of our variables, and the cheese/decision-square distance regression coefficients never experienced a sign flip. The cheese/top-right Euclidean distance had a few sign flips. Other variables sign-flip much more frequently.
We consider this to be strong evidence against multicollinearity having distorted our original regressions.
Can our three features explain the network’s behavior?
Are variables 1)-3) ‘enough’ to explain the network’s behavior? Let’s see how much predictive accuracy we retain when regressing only on 1)-3).
Regression accuracy
82.4%
Attribute
Coefficient
Euclidean distance between cheese and top-right square
-1.405
Steps between cheese and decision-square
-0.577
Euclidean distance between cheese and decision-square
-0.516
Intercept
1.355
There is a 1.7% accuracy drop compared to the original multiple regression. Unfortunately, it’s hard to interpret this accuracy gap in terms of the contributions of individual variables outside 1)-3). Adding practically any 4th variable to 1)-3) flips delivers big accuracy gains that don’t additively accrue when combined, and the new variable’s sign is often flipped relative to its single-regression sign.
See for example 1)-3) + ‘legal steps from cheese to top-right square’:
Regression accuracy
84.1%
Attribute
Coefficient
Steps between cheese and top-right square
1.099
Euclidean distance between cheese and top-right square
-2.181
Steps between cheese and decision-square
-1.211
Euclidean distance between cheese and decision-square
-0.515
Intercept
1.380
Or 1)-3) + ‘legal steps from cheese to top-right square’ + ‘Euclidean distance from decision-square to top-right 5x5’:
Regression accuracy
84.5%
Attribute
Coefficient
Euclidean distance between decision-square and top-right 5x5
1.239
Steps between cheese and top-right square
0.038
Euclidean distance between cheese and top-right square
-2.652
Steps between cheese and decision-square
-0.911
Euclidean distance between cheese and decision-square
-0.419
Intercept
1.389
Our instinct is therefore to avoid interpreting variables like ‘Euclidean distance from decision-square to 5x5’ or ‘legal steps distance from cheese to top-right square.’ Additional experimentation shows that these variables are only predictive in settings where they sign-flip relative to their single-regression coefficients, that their predictive powers don’t stack, and that their statistical effects do not correspond to any intuitive mechanism.
Testing redundancy between spatial and step-wise distances
Let’s get back to our claimed predictive variables:
Euclidean distance from cheese to top-right square
Legal steps distance from decision-square to cheese
Euclidean distance from decision-square to cheese
How sure should we be that variables 1)-3) each track a real and distinct causal mechanism?
For variables 1) and 2), we have extensive though non-rigorous experience making manual maze-edits that decrease/increase cheese-getting by changing the relevant distance with minimal logical side-effects. For example, increasing the number of legal steps from decision-square to cheese while keeping all Euclidean distances the same reliably reduces the probability that the agent moves in the cheese direction:[7]
Zoomed-in view of the upper-left quartile of hand-edited large mazes. Step-distance in blue, Euclidean distance in green.
Our experience making similar maze-edits for variable 3) has been mixed and limited, as they are harder to produce. Still, the results of edits that manipulate 3) are often suggestive (if hard to interpret).
Keeping these qualitative impressions in mind, let’s test variables 1)-3) for statistical redundancy by dropping variables and seeing how that impacts accuracy.
Considering our qualitative and statistical results together, we are confident that dstep(cheese,decision-square) tracks a real decision influence.
We weakly believe that dEuclidean(cheese,decision-square) tracks an additional real decision influence. More evidence for this is that removing the cheese/square distances cause comparable accuracy drops. And we’re already confident that dstep(cheese,decision-square) tracks a real decision-influence!
Our biggest source of doubt about dEuclidean(cheese,decision-square) is that when running regression on another independent batch of 10,000 test-runs we found no loss at all when dropping this variable from 1)-3). This was surprising, since we were otherwise able to reproduce all our qualitative results (e.g. rankings of variables’ predictive strength, sign-flipping patterns) across sample batches.[8]
Conclusion
Our statistics refine, support, and stress-test our impressions about the network’s behavior. This behavior seems more easily describable using a shard theory frame than a utility frame. We think our statistical results are not artifacts of multicollinearity, but hold up quite well.[9]
However, the statistics are not fully rigorous, and this post’s analysis contained freeform domain-specific reasoning. That said, we are overall very confident that the agent is influenced by dEuclidean(cheese,top-right) and by dstep(cheese,decision-square). We have weak but suggestive evidence for additional influence fromdEuclidean(cheese,decision-square).
Counterexamples are possible but likely to be statistically insignificant. We haven’t formally checked whether counterexamples can be found in the training set.
We think it’s clear that the agent cannot be perfectly characterized by any reasonable utility-theoretic description, let alone a time-consistent utility function over state variables like “cheese” and “top-right.” What’s at stake here is the question of the best systematic approximation of the agent’s behaviour.
The question ‘does the agent have the same goal at every time-step in a given maze?’ requires looking at more than one time-step in a given maze. Therefore, statistics on the agent’s behaviour on the decision-square alone cannot distinguish between a dynamically inconsistent agent and an equilibrated agent whose utility function has a shard-like explanation.
However, action-probability vector field plots display information about all possible maze locations. These plots are a valuable source of evidence on whether the agent is dynamically consistent.
We also added one more variable: the norm of the cheese’s coordinates in the network’s reflective field. The norm represents a “minimalist” interpretation of the effect of cheese-closeness to the top-right. (The top-right square of the maze varies level to level and requires sophisticated global computations to identify, whereas coordinates information is static.)
We don’t mean for our analysis to be predicated on the magnitudes of the regression coefficents. We know these are unreliable and contingent quantities! We mentioned their relative stability more as diagnostic evidence.
Our manual interventions look directly at the probability of making a first move towards cheese at the decision-square, rather than at the frequency of cheese-getting. This is especially useful when studying the influence of legal-steps distance, since the effect on cheese-getting could be an artifact of the shorter chain of ‘correct’ stochastic outcomes required to take the cheese when the step-distance is short.
We suspect that we would observe a clearer effect for dEuclidean(cheese,decision-square) if we did statistics on action logits around the decision-square instead of on cheese-getting frequencies, but there’s substantial overhead to getting these statistics.
The main thing Alex would have changed about the original post is to not make the dEuclidean(cheese,decision-square) influence a headline result (in the summary).
Do you think that a larger network, a different architecture, and sufficient RL would be capable of learning an explicit representation of a more “consequentialist” algorithm for maze-solving, like Dijkstra’s algorithm or A*?
Or do you think that this is ruled out, absent a radically different training process or system architecture?
I’m not sure about the answers to these questions, but I think that if you could get a big enough RL-trained network to learn and use an explicit path-finding algorithm, that network would be better at getting the cheese, possibly exhibiting a discontinuous performance jump and change in behavior.
Or, put another way: this is interesting interpretability work, but the model itself seems too weak to draw many conclusions about whether the decision-making processes of smarter agents will be more consequentialist (“utility-theoretic?” not sure if we’re talking about precisely the same thing here) or more shard-like.
My own prediction is that a consequentialist model of the system as a cheese-finder becomes a simpler and more predictively-accurate model of behavior than shard theory as performance improves. I’ll make the stronger but less concrete prediction that the consequentialist view begins to outperform the shard view in predictive accuracy at or even below human-level capabilities (in general, not just for maze solving).
Do you think that a larger network, a different architecture, and sufficient RL would be capable of learning an explicit representation of a more “consequentialist” algorithm for maze-solving, like Dijkstra’s algorithm or A*?
Or do you think that this is ruled out, absent a radically different training process or system architecture?
This is a good question to think about. I think this possibility is basically ruled out, unless you change the architecture quite a bit. Search is very awkward to represent in deep conv nets, AFAICT.
Concretely, I think these models are plenty “strong” at this task:
The networks are trained until they get the cheese in nearly every episode.
The model we studied is at least 4x overparameterized for the training task. Langosco et al. trained a model which has a quarter the channels at each layer in the network. This network also converges to getting the cheese every time.
Uli retrained his own networks (same architecture) and found them to exhibit similar behavior.
I don’t think there are commensurably good reasons to think this model is too weak. More speculatively, I don’t think people would have predicted in advance that it’s too weak, either. For example, before even considering any experiments, I watched the trajectory videos and looked at the reward curves in the paper. I personally did not think the network was too weak. It seemed very capable to me, and I still think it is.
consequentialist
I think shard agents can be very consequentialist. There’s a difference between “making decisions on the basis of modelled consequences” and “implementing a relatively crisp search procedure to optimize a fixed-across-situations objective function.”[1] “Utility-theoretic” is more the latter, of the agent being well-modelled as doing the latter.
I’ll make the stronger but less concrete prediction that the consequentialist view begins to outperform the shard view in predictive accuracy at or even below human-level capabilities (in general, not just for maze solving).
We run into obstacles here because this is probably not what some people mean when they use utility-theoretic. I sometimes don’t know what internal motivational structures people are positing by “utility-theoretic”, and am happy to consider the predictions made by any specific alternative grounding.
Thanks for the thoughtful response (and willingness to bet)!
Do you think that your results would replicate if applied to DreamerV3 trained on the same task? That’s the kind of thing I had in mind as a “stronger” model, not just more parameters.
Dreamer is comprised of 3 networks (modeler, critic, and actor), but it is still a general reinforcement learning algorithm, so I think this is a relatively straightforward / fair comparison.
My prediction is no: specifically, given the same training environment, dreamer would converge more quickly to getting the cheese every time in training, and then find the cheese more often than 69% of the time in test (maybe much more, or always).
I’d be willing to bet on this, and / or put up a small bounty for you or someone else to actually run this experiment, if you have a different prediction.
(For anyone who wants to try this: the code for dreamer and the cheese task are available, and the cheese task is a gym, so it should be relatively straightforward to run this experiment.)
OTOH, if you agree with my prediction, I’d be interested in hearing why you think this isn’t a problem for shard theory. In general, I expect that DreamerV-N+1 and future SotA RL algorithms look even more like pure reward-function maximizers, given even less (and less general) training data.
Do you think that your results would replicate if applied to DreamerV3 trained on the same task?
Which results? Without having read more than a few figures from the paper:
I expect that DreamerV3 would be more sample efficient and so converge more quickly to getting the cheese every time during training
I expect that DreamerV3 would still train policy nets which don’t get the cheese all the time in test, although I wouldn’t be more surprised if it got it more than 69% of the time. I’d be somewhat surprised by >90%, and very surprised by >99%.
I think that, given the same architecture (deep conv net) and hyperparameter settings, probably the cheese vector replicates.
I think there’s also a good chance that the retargetability replicates (although using different channel numbers, of course, there was no grand reason why 55 was a cheese-tracking-channel).
Again, IDK this particular alg; I’m just imagining good model-based RL + exploration → a policy net. (If DreamerV3 does planning using its WM at inference time, that seems like a more substantially different story.)
If you think we disagree enough to have a bet here, lmk and I’ll read the alg more next week to give you some odds.
That’s the kind of thing I had in mind as a “stronger” model, not just more parameters.
...
In general, I expect that DreamerV-N+1 and future SotA RL algorithms look even more like pure reward-function maximizers, given even less (and less general) training data.
The most capable systems today (LLMs) don’t rely on super fancy RL algs—they often use PPO or some variant—and they get stronger in large part by getting more data and parameters.
However, it’s still interesting to understand how diff training processes produce diff kinds of behavior. So I think the experiment you propose is interesting, but I think shard theory-for-LLMs ultimately doesn’t gain or lose a ton either way.
Again, IDK this particular alg; I’m just imagining good model-based RL + exploration → a policy net. (If DreamerV3 does planning using its WM at inference time, that seems like a more substantially different story.)
The world model is a recurrent state space model, and the actor model takes the latent state of the world model as input. But there’s no tree search or other hand-coded exploration going on during inference.
I expect that DreamerV3 would still train policy nets which don’t get the cheese all the time in test, although I wouldn’t be more surprised if it got it more than 69% of the time. I’d be somewhat surprised by >90%, and very surprised by >99%.
This is the question I am most interested in. I’d bet at even odds that Dreamer-XL or even Dreamer-medium would get the cheese >90% of the time, and maybe 1:4 (20% implied probability) on >99%.
On other results:
Not sure if the recurrence makes some of the methods and results in the original post inapplicable or incomparable. But I do expect you can find cheese vectors and do analogous things with retargetability, perhaps by modifying the latent state of the world model, or by applying the techniques in the original post to the actor model.
I expect that many of the behavioral statistics detailed in this post mostly don’t replicate, primarily because p(cheese acquired) goes up dramatically. For episodes where the agent doesn’t get the cheese (if there are any), I’d be curious what they look like. I don’t have strong predictions here, but I wouldn’t be surprised if they look qualitatively different and are not well predicted by the three features here. I think some of the most interesting comparisons would be between mazes where both agents fail to get the cheese—do they end up in the same place, by the same path, for example?
I’d maybe point the finger more at the simplicity of the training task than at the size of the network? I’m not sure there’s strong reason to believe the network is underparameterized for the training task. But I agree that drawing lessons from small-ish networks trained on simple tasks requires caution.
I’d maybe point the finger more at the simplicity of the training task than at the size of the network?
I also predict that if you modify (improve?) the training process, perhaps only slightly, the behaviors you observe go away and you get a pure cheese-finder.
(Caveat: I’m not super familiar with the literature on goal mis-generalization and Langosco et al.; what follows is just based on my reading of this post and the previous ones in the sequence.)
From the previous post:
During RL training, cheese was randomly located in the top-right 5×5 corner of the randomly generated mazes. In deployment, cheese can be anywhere. What will the agent do?
The net is trained until it reaches the cheese basically every episode.
Concretely, I’m predicting that, if there were training examples where the cheese was located in, say, the bottom-right corner, you probably wouldn’t end up with an agent that sometimes goes to the top-right, sometimes to the bottom-right, and sometimes to the cheese, or even an agent that learns a “going right” shard (as a combination of the top-right and bottom-right shards), and a cheese-finding shard. The agent would just always, or nearly always, find the cheese in the test environment.
Or, if you want to make sure the training → test environment requires the same amount of generalization (by the metric of number of squares in which the cheese can appear in the training process vs. the test environment), fix 25 (or perhaps fewer) random squares where the cheese can appear throughout the maze during training, not restricted to the top-right.
Put differently, the behaviors in Statistically informed impressions seem relevant only in the regime where P(cheese acquired) is not close to 1. That seems like a pretty fragile / narrow / artificial condition, at least for maze-solving.
I’m looking forward to seeing more follow up work on this though. I do think there are a lot of interesting interpretability questions this kind of experimentation can answer. What happens if you subtract the cheese vector from a perfect cheese finder, for example?
I also predict that if you modify (improve?) the training process, perhaps only slightly, the behaviors you observe go away and you get a pure cheese-finder.
I anti-predict this for many slight changes. For example, in an above comment I wrote:
I think there’s a good chance that the following gets you something closer to an agent with a global cheese-shard, though:
Or, if you want to make sure the training → test environment requires the same amount of generalization (by the metric of number of squares in which the cheese can appear in the training process vs. the test environment), fix 25 (or perhaps fewer) random squares where the cheese can appear throughout the maze during training, not restricted to the top-right.
I’d be interested in how performance (defined as how often the agent goes to the cheese) in the test environment varies as you vary n in this experiment. For n = 5, this is 69.1%, right?
For reference, the agent gets the cheese in 69.1% of these mazes, and so a simple “always predict ‘gets the cheese’” predictor would get 69.1% accuracy.
For the 15x15 agent, my prediction is that P(cheese acquired) is above 95%, though as you point out that’s kind of an unfair or at least not very meaningful test of generalization.
For an agent trained in an environment where the cheese can appear in the union of a 5x5 square in the top right and a 5x5 square in the bottom right (or even 4x4, to keep the “amount of generalization” roughly constant / consistent by some metric), I predict that the performance in the test environment is well over 69%. [edit: and further, that it is over the performance of whatever the 6x6 agent is, which I also predict is higher than 69%]
For the cases where this agent doesn’t go to the cheese (if there are any such cases) in the test environment, I’d be very curious what shard theory predicts these look like. When the agent doesn’t find the cheese, is this because it sometimes ends up in the top right and sometimes in the bottom right? Or does it end up in the middle right? Something else? I have no strong prediction here, but I’m curious about what your predictions are and whether shard theory has anything to say here.
I’d be interested in how performance (defined as how often the agent goes to the cheese) in the test environment varies as you vary n in this experiment. For n = 5, this is 69.1%, right?
The original paper investigated this, actually. In the following, the y-axis shows P(gets cheese) * (10 reward for getting cheese).
(Note that even for n=15 I was able to find a few videos where the agent doesn’t go to the cheese. I don’t remember exactly where the agent went, I thiink it was up and right.)
For the 15x15 agent, my prediction is that P(cheese acquired) is above 95%, though as you point out that’s kind of an unfair or at least not very meaningful test of generalization.
Nice prediction!
I’d be very curious what shard theory predicts these look like. When the agent doesn’t find the cheese, is this because it sometimes ends up in the top right and sometimes in the bottom right? Or does it end up in the middle right? Something else? I have no strong prediction here, but I’m curious about what your predictions are and whether shard theory has anything to say here
Interesting question, thanks. My first impulse is: The agent ends up along some path which goes right (either up or down) but which doesn’t end up going to cheese. I don’t know whether I’d expect it to learn to go to right in general, or has both a top-right shard and a bottom-right shard, or something else entirely. I’m leaning towards the first one, where conditional on no cheese, the agent ends up going on some path that takes it really far right and also makes its y-position be either high or low.
This brings up something interesting: seems worthwhile to compare the internals of a ‘misgeneralizing,’ small n agent with those of large a n agents and check whether there seems to be a phase transition in how the network operates internally or not.
Do you think that a larger network, a different architecture, and sufficient RL would be capable of learning an explicit representation of a more “consequentialist” algorithm for maze-solving, like Dijkstra’s algorithm or A*?
Or do you think that this is ruled out, absent a radically different training process or system architecture?
I’m not sure about the answers to these questions, but I think that if you could get a big enough RL-trained network to learn and use an explicit path-finding algorithm, that network would be better at getting the cheese, possibly exhibiting a discontinuous performance jump and change in behavior.
Or, put another way: this is interesting interpretability work, but the model itself seems too weak to draw many conclusions about whether the decision-making processes of smarter agents will be more consequentialist (“utility-theoretic?” not sure if we’re talking about precisely the same thing here) or more shard-like.
My own prediction is that a consequentialist model of the system as a cheese-finder becomes a simpler and more predictively-accurate model of behavior than shard theory as performance improves. I’ll make the stronger but less concrete prediction that the consequentialist view begins to outperform the shard view in predictive accuracy at or even below human-level capabilities (in general, not just for maze solving).
This is a good question to think about. I think this possibility is basically ruled out, unless you change the architecture quite a bit. Search is very awkward to represent in deep conv nets, AFAICT.
Concretely, I think these models are plenty “strong” at this task:
The networks are trained until they get the cheese in nearly every episode.
The model we studied is at least 4x overparameterized for the training task. Langosco et al. trained a model which has a quarter the channels at each layer in the network. This network also converges to getting the cheese every time.
Our e.g. cheese-vector analysis qualitatively holds for a range of agents with different training distributions (trained with cheese in the top-right nxn corner, for n=2,...,15). Inspecting the vector fields, they are all e.g. locally attracted by cheese. Even the 15x15 agent goes to the top-right corner sometimes! (Levels are at most 25x25; a 15x15 zone is, in many maze sizes, equivalent to “the cheese can be anywhere.”)
Uli retrained his own networks (same architecture) and found them to exhibit similar behavior.
I don’t think there are commensurably good reasons to think this model is too weak. More speculatively, I don’t think people would have predicted in advance that it’s too weak, either. For example, before even considering any experiments, I watched the trajectory videos and looked at the reward curves in the paper. I personally did not think the network was too weak. It seemed very capable to me, and I still think it is.
I think shard agents can be very consequentialist. There’s a difference between “making decisions on the basis of modelled consequences” and “implementing a relatively crisp search procedure to optimize a fixed-across-situations objective function.”[1] “Utility-theoretic” is more the latter, of the agent being well-modelled as doing the latter.
I think this is wrong, and am willing to make a bet here if you want. I think that even e.g. GPT-4 is not well-predicted by a consequentialist view, and is well-predicted by modelling it as having shards. I also think the shard view outperforms the consequentialist view for humans themselves, who I currently think are relatively learned-from-scratch and trained via somewhat (but not perfectly) similar training processes.
We run into obstacles here because this is probably not what some people mean when they use utility-theoretic. I sometimes don’t know what internal motivational structures people are positing by “utility-theoretic”, and am happy to consider the predictions made by any specific alternative grounding.
Thanks for the thoughtful response (and willingness to bet)!
Do you think that your results would replicate if applied to DreamerV3 trained on the same task? That’s the kind of thing I had in mind as a “stronger” model, not just more parameters.
Dreamer is comprised of 3 networks (modeler, critic, and actor), but it is still a general reinforcement learning algorithm, so I think this is a relatively straightforward / fair comparison.
My prediction is no: specifically, given the same training environment, dreamer would converge more quickly to getting the cheese every time in training, and then find the cheese more often than 69% of the time in test (maybe much more, or always).
I’d be willing to bet on this, and / or put up a small bounty for you or someone else to actually run this experiment, if you have a different prediction.
(For anyone who wants to try this: the code for dreamer and the cheese task are available, and the cheese task is a gym, so it should be relatively straightforward to run this experiment.)
OTOH, if you agree with my prediction, I’d be interested in hearing why you think this isn’t a problem for shard theory. In general, I expect that DreamerV-N+1 and future SotA RL algorithms look even more like pure reward-function maximizers, given even less (and less general) training data.
Which results? Without having read more than a few figures from the paper:
I expect that DreamerV3 would be more sample efficient and so converge more quickly to getting the cheese every time during training
I expect that DreamerV3 would still train policy nets which don’t get the cheese all the time in test, although I wouldn’t be more surprised if it got it more than 69% of the time. I’d be somewhat surprised by >90%, and very surprised by >99%.
I think that, given the same architecture (deep conv net) and hyperparameter settings, probably the cheese vector replicates.
I think there’s also a good chance that the retargetability replicates (although using different channel numbers, of course, there was no grand reason why 55 was a cheese-tracking-channel).
Again, IDK this particular alg; I’m just imagining good model-based RL + exploration → a policy net. (If DreamerV3 does planning using its WM at inference time, that seems like a more substantially different story.)
If you think we disagree enough to have a bet here, lmk and I’ll read the alg more next week to give you some odds.
The most capable systems today (LLMs) don’t rely on super fancy RL algs—they often use PPO or some variant—and they get stronger in large part by getting more data and parameters.
However, it’s still interesting to understand how diff training processes produce diff kinds of behavior. So I think the experiment you propose is interesting, but I think shard theory-for-LLMs ultimately doesn’t gain or lose a ton either way.
The world model is a recurrent state space model, and the actor model takes the latent state of the world model as input. But there’s no tree search or other hand-coded exploration going on during inference.
This is the question I am most interested in. I’d bet at even odds that Dreamer-XL or even Dreamer-medium would get the cheese >90% of the time, and maybe 1:4 (20% implied probability) on >99%.
On other results:
Not sure if the recurrence makes some of the methods and results in the original post inapplicable or incomparable. But I do expect you can find cheese vectors and do analogous things with retargetability, perhaps by modifying the latent state of the world model, or by applying the techniques in the original post to the actor model.
I expect that many of the behavioral statistics detailed in this post mostly don’t replicate, primarily because p(cheese acquired) goes up dramatically. For episodes where the agent doesn’t get the cheese (if there are any), I’d be curious what they look like. I don’t have strong predictions here, but I wouldn’t be surprised if they look qualitatively different and are not well predicted by the three features here. I think some of the most interesting comparisons would be between mazes where both agents fail to get the cheese—do they end up in the same place, by the same path, for example?
I’d maybe point the finger more at the simplicity of the training task than at the size of the network? I’m not sure there’s strong reason to believe the network is underparameterized for the training task. But I agree that drawing lessons from small-ish networks trained on simple tasks requires caution.
I also predict that if you modify (improve?) the training process, perhaps only slightly, the behaviors you observe go away and you get a pure cheese-finder.
(Caveat: I’m not super familiar with the literature on goal mis-generalization and Langosco et al.; what follows is just based on my reading of this post and the previous ones in the sequence.)
From the previous post:
Concretely, I’m predicting that, if there were training examples where the cheese was located in, say, the bottom-right corner, you probably wouldn’t end up with an agent that sometimes goes to the top-right, sometimes to the bottom-right, and sometimes to the cheese, or even an agent that learns a “going right” shard (as a combination of the top-right and bottom-right shards), and a cheese-finding shard. The agent would just always, or nearly always, find the cheese in the test environment.
Or, if you want to make sure the training → test environment requires the same amount of generalization (by the metric of number of squares in which the cheese can appear in the training process vs. the test environment), fix 25 (or perhaps fewer) random squares where the cheese can appear throughout the maze during training, not restricted to the top-right.
Put differently, the behaviors in Statistically informed impressions seem relevant only in the regime where P(cheese acquired) is not close to 1. That seems like a pretty fragile / narrow / artificial condition, at least for maze-solving.
I’m looking forward to seeing more follow up work on this though. I do think there are a lot of interesting interpretability questions this kind of experimentation can answer. What happens if you subtract the cheese vector from a perfect cheese finder, for example?
I anti-predict this for many slight changes. For example, in an above comment I wrote:
I think there’s a good chance that the following gets you something closer to an agent with a global cheese-shard, though:
I’d be interested in how performance (defined as how often the agent goes to the cheese) in the test environment varies as you vary n in this experiment. For n = 5, this is 69.1%, right?
For the 15x15 agent, my prediction is that P(cheese acquired) is above 95%, though as you point out that’s kind of an unfair or at least not very meaningful test of generalization.
For an agent trained in an environment where the cheese can appear in the union of a 5x5 square in the top right and a 5x5 square in the bottom right (or even 4x4, to keep the “amount of generalization” roughly constant / consistent by some metric), I predict that the performance in the test environment is well over 69%. [edit: and further, that it is over the performance of whatever the 6x6 agent is, which I also predict is higher than 69%]
For the cases where this agent doesn’t go to the cheese (if there are any such cases) in the test environment, I’d be very curious what shard theory predicts these look like. When the agent doesn’t find the cheese, is this because it sometimes ends up in the top right and sometimes in the bottom right? Or does it end up in the middle right? Something else? I have no strong prediction here, but I’m curious about what your predictions are and whether shard theory has anything to say here.
The original paper investigated this, actually. In the following, the y-axis shows P(gets cheese) * (10 reward for getting cheese).
(Note that even for n=15 I was able to find a few videos where the agent doesn’t go to the cheese. I don’t remember exactly where the agent went, I thiink it was up and right.)
Nice prediction!
Interesting question, thanks. My first impulse is: The agent ends up along some path which goes right (either up or down) but which doesn’t end up going to cheese. I don’t know whether I’d expect it to learn to go to right in general, or has both a top-right shard and a bottom-right shard, or something else entirely. I’m leaning towards the first one, where conditional on no cheese, the agent ends up going on some path that takes it really far right and also makes its y-position be either high or low.
This brings up something interesting: seems worthwhile to compare the internals of a ‘misgeneralizing,’ small n agent with those of large a n agents and check whether there seems to be a phase transition in how the network operates internally or not.