A benchmark is a sensor
The simple mental picture
A simple mental picture we have for an AI capability benchmark is to think of it as a sensor with a certain sensitivity within a certain range of capabilities. The sensitivity of a benchmark, i.e. it’s ability to distinguish the capability of different models, is given by a curve like this:
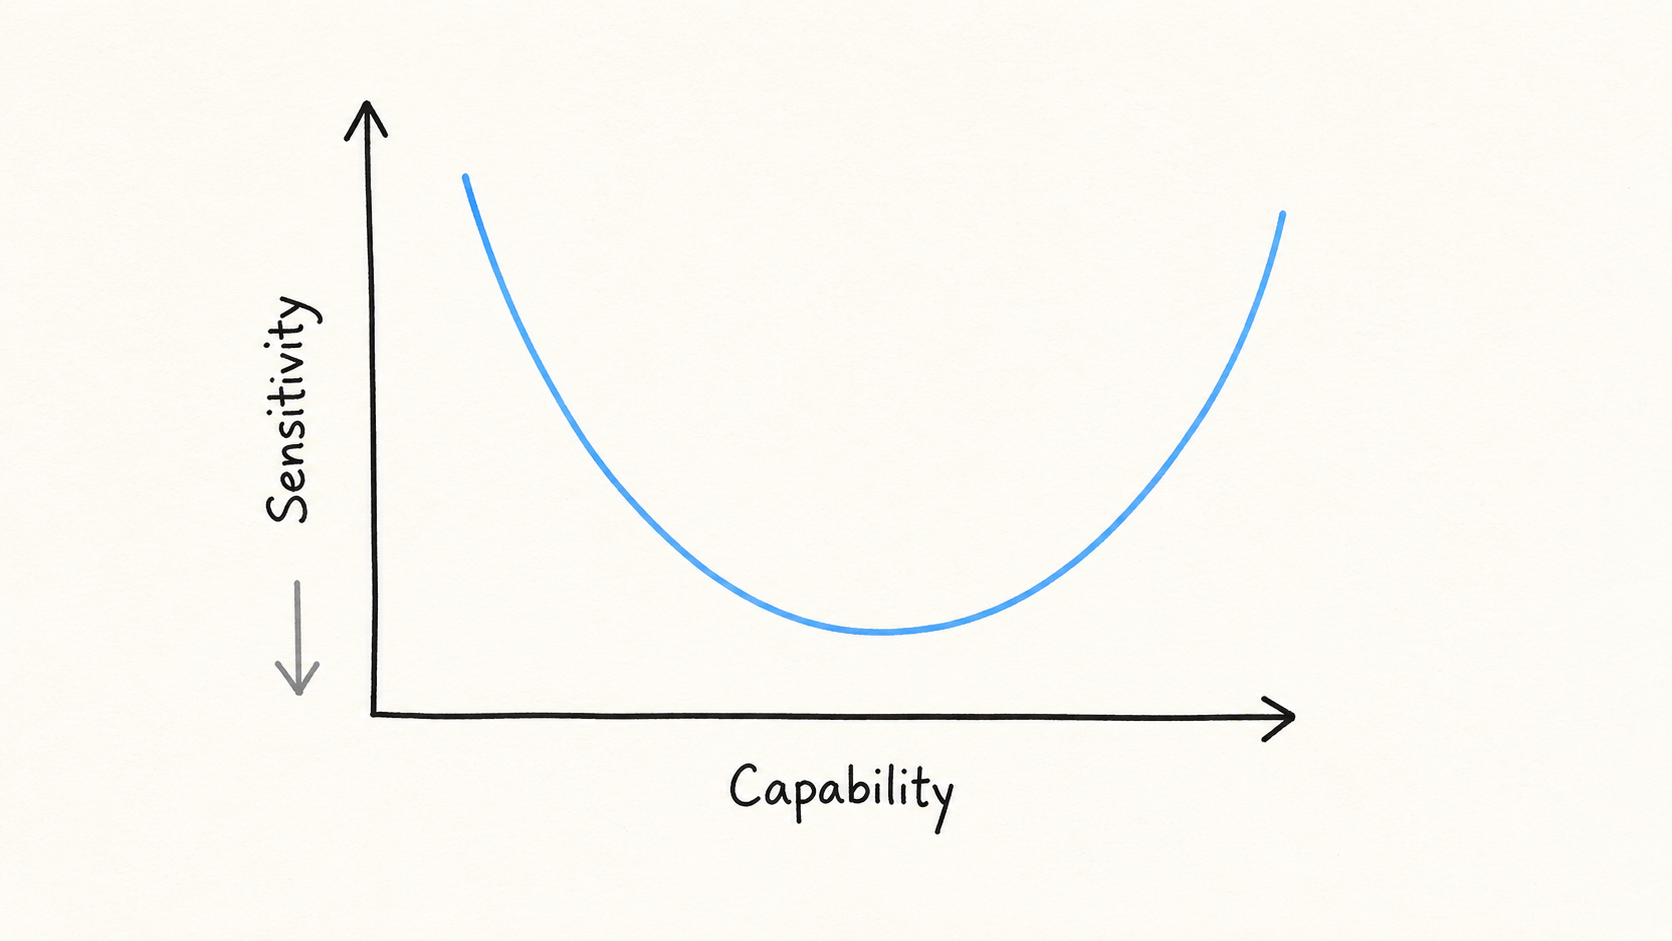
The curve starts high (low sensitivity, high uncertainty), since for models with low capability all the tasks in the benchmark are too hard, and the benchmark can’t distinguish between low and very low capability. Similarly all the tasks are too easy for a very capable model, and we lose the ability to differentiate again. In between is the range of capabilities the benchmark is sensitive to, and the sensitivity curve tells you how easy it is to distinguish small capability differences between models at different overall capability levels.
A good benchmark is very sensitive over a long range of capabilities, but there is a tradeoff. Say you want to make a benchmark with 1000 questions. You could make the questions all have roughly the same difficulty. That would make you very sensitive to capabilities close to that difficulty, but you would only be sensitive in this narrow range. However, if you make the questions have very different difficulty, you get some sensitivity to a wide range of capabilities, but you have very few questions at each specific capability level, so your results will be noisy (low sensitivity). Increasing the number of questions will make you more sensitive across the board.
A benchmark will generally have different sensitivity to different capabilities, so SWE-Bench Pro will be more sensitive to agentic coding capability, and less (although still somewhat) sensitive to, say, math capability.
Epoch Capability Index (ECI) as a toy model
The ECI maps any specific benchmark into a common index using a sigmoid transformation
where
If you then tell me how well a model does on a given benchmark, I can tell you (assuming we know the slope, difficulty and noise level for that benchmark) what the model’s ECI-score will be (with a certain precision), and this precision is the sensitivity of the benchmark!
Using Epochs public code for estimating the ECI (github) we can plot the sensitivity curves for a selection of benchmarks.

ECI sensitivity plots for a few selected public benchmarks for a range of model capabilities. The higher the value, the higher the uncertainty (lower sensitivity).
Here we have used the residuals (data—model) to estimate the noise level of each benchmark, then divide by the derivative of the sigmoid to convert this noise-level to the corresponding uncertainty in ECI.
As an example, say someone tells you that GPT 5.6 scores 50% on FrontierMath T4 Private. Our toy model then gives a precise estimate for ECI of 161.6

Lines: The predicted performance on each benchmark as a function of model capability. Dots: Real model performances on each benchmark as reported by Epoch.
Take the specific curves here with a huge grain of salt, since they depend on the very simplified assumptions in our toy model. In particular, while the sigmoid curve fits pretty well for the benchmarks we have looked at, the constant noise assumption is not very good at the tails of the sigmoids, where the variance tends to be lower than at the midpoint. So the toy model works best for benchmark scores in the middle range of the sigmoids.
Anyways, the details are not that important, what we want to get across is the simple mental picture: a benchmark score is a measurement with an implicit error bar in capability space, and the size of that bar depends on where the model sits on the benchmark’s sensitivity curve for that capability.
Thanks for this, it has been bounding about in my head for a bit and I think it speaks to two schools of thought one can have about individual benchmarks:
1. They tell us whether/how well LLMs can do a specific task of interest, where we care about something like ‘can LLMs do the task with most performant reasonable harness/setup’. Cyber capabilities might be one example of these, where we are interested in whether there is any way to apply LLMs to compromise certain systems. Proving maths theorems might be another.
2. The tasks themselves are meaningless/of no interest, but they give useful information about the capabilities of the model in a certain dimension. I think most benchmarks are like this.
I think this post is true when viewing benchmarks from the 2nd perspective, but it is worth remembering that the 1st is also sometimes applicable.
That’s an interesting distinction.
I do think a pure case of 1 is rare because usually what constitutes a specific task or capability is not contained or narrowly defined enough that a benchmark can sample from the whole distribution of that task/capability. Usually a benchmark will just sample a small and verifiable part of the distribution of tasks of a specific type, which is hopefully correlated with the more general capability on that type of task.
Math is an interesting case. If you consider for example IMO problems, that is basically such a well defined task/capability, and actual IMO problems are samples from this distribution, so the benchmark measures the capability exactly and directly, and the precision of the measurement could be increased indefinitely by just drawing new samples. Other subfields of math could perhaps be somewhat similar, where finding proofs for each of a certain class of theorems forms a similar well defined problem class, although I’m not very familiar with academic math.
Another (*very* similar) framework is item response theory. The model you’re using would correspond to what’s called a 2PL model, named because it has two parameters: difficulty and discrimination. IRT difficulty measures the difficulty of an item and corresponds to difficulty in your model; IRT discrimination measures how sharply an item distinguishes between individuals near a given ability level and corresponds to the slope in your model. In the 2PL model, the probability of a person answering an item correctly is
They also have something called the item information curve, which graphs how precisely an item measures a trait across different levels of that trait. Though they graph the inverse squared standard error (information), rather than the standard error itself like you do. (I think their way of graphing it makes prettier graphs, though.)
Yea, I assume the ECI model is directly inspired by IRT. We did not go into the methodological details of the toy model, since what we wanted to get across is the simple mental picture, and ECI-model + noise was the simplest toy model (with actual data).
We’re thinking about IRT/2PL in this context as well. Since you can approximate any sensitivity curve by a set of binary questions/items/tasks with a distibution of difficulties and discriminations, it would be interesting to quantify the sensitivity of a benchmark by the how many equivalent binary items a benchmark sensitivity would correspond to. However, it seems to me that such a decomposition into IRT items would not be unique, so I’m not sure how to do this.
As for plotting with sigma on the y-axis, that was just to make the y-axis easily interpretable, and it’s also the way I’ve been visualizing the idea in my head (before formulating it here).